
Signals:
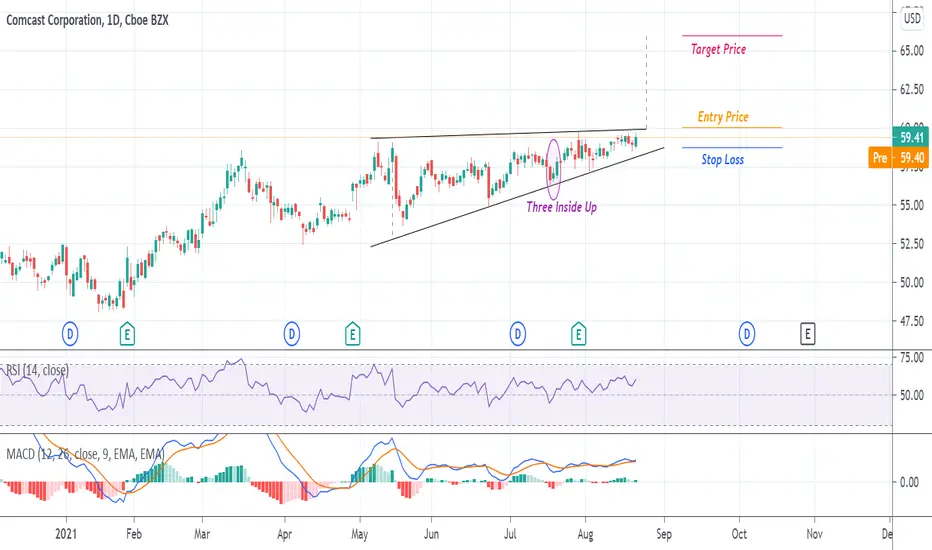
Position: Long Entry Price: 59.49
Target Price: 66.32Stop Loss: 58.79
Indicators:
RSI shows that CMCSA is neutral, indicating that a significant trend reversal or corrective pullback is unlikely to occur in the near future.
MACD line is above the signal line indicating the presence of a bullish momentum.
Pattern: 1. Rising Wedge 2. Three Inside Up
Conclusion:
The CMCSA stock is currently consolidating whilst staying within the support and resistance levels. There is a rising wedge pattern and a three inside up pattern both indicating the presence of a bullish momentum. The RSI and MACD do not show any potential of trend reversals in the near future. Hence, a long position is recommended.
Position: Long Entry Price: 59.49
Target Price: 66.32Stop Loss: 58.79
Indicators:
RSI shows that CMCSA is neutral, indicating that a significant trend reversal or corrective pullback is unlikely to occur in the near future.
MACD line is above the signal line indicating the presence of a bullish momentum.
Pattern: 1. Rising Wedge 2. Three Inside Up
Conclusion:
The CMCSA stock is currently consolidating whilst staying within the support and resistance levels. There is a rising wedge pattern and a three inside up pattern both indicating the presence of a bullish momentum. The RSI and MACD do not show any potential of trend reversals in the near future. Hence, a long position is recommended.

💥 Free signals and ideas ➡ t.me/vfinvestment
Feragatname
Bilgiler ve yayınlar, TradingView tarafından sağlanan veya onaylanan finansal, yatırım, alım satım veya diğer türden tavsiye veya öneriler anlamına gelmez ve teşkil etmez. Kullanım Koşulları bölümünde daha fazlasını okuyun.
💥 Free signals and ideas ➡ t.me/vfinvestment
Feragatname
Bilgiler ve yayınlar, TradingView tarafından sağlanan veya onaylanan finansal, yatırım, alım satım veya diğer türden tavsiye veya öneriler anlamına gelmez ve teşkil etmez. Kullanım Koşulları bölümünde daha fazlasını okuyun.