Cotton No. 2 ( COTTON) Daily: 5-Wave Elliott Impulse Advances Towards 8,907 Macro Ceiling Following 0.618 Fibo Rebound
### 🌾 Cotton No. 2 CFD (COTTON) Daily Technical Matrix (Ref: COTTON_2026-08-06_08-56-13.png)
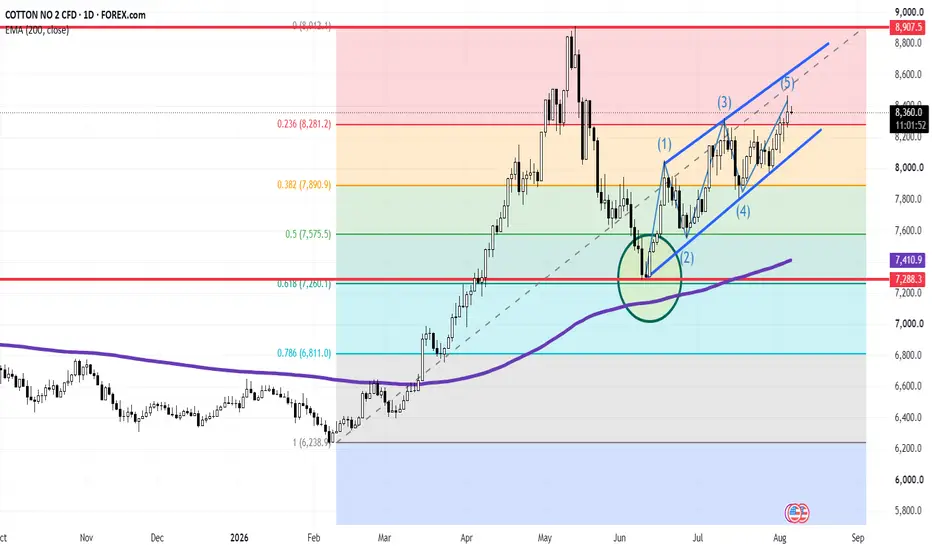
We are releasing a Daily (1D) Elliott Wave structural framework on Cotton No. 2 (COTTON). Following a clean technical reaction off key multi-confluence support inside the highlighted green circle, price action has been executing a textbook 5-wave motive impulse within an ascending parallel channel.
The commodity is currently trading around **8,362.5 (-0.03%)**, pressing above the **0.236 Fibonacci retracement level at 8,281.2**.
---
### 🔍 Technical Architecture & Wave Structure Analysis:
Our quantitative setup isolates the mechanical progression of this bullish cycle:
1. **Foundational Launchpad (Green Circle Confluence):** The primary structural bottom (Wave 2 pivot) was anchored at the confluence of the **0.618 Golden Ratio Fibonacci level (7,260.1)**, the horizontal static support line (**7,288.3**), and the institutional **200-period EMA (purple line at 7,410.9)**.
2. **5-Wave Impulse Progression (Blue Vector Corridor):**
* **Waves (1) & (2):** Initial directional breakout followed by a higher-low correction off dynamic channel support.
* **Waves (3) & (4):** Extended expansion leg testing **8,281.2**, followed by a controlled pullback holding the **0.382 Fibonacci retracement node (7,890.9)**.
* **Wave (5) Terminal Leg:** Active impulse driving price action toward the upper ascending boundary of the blue channel.
---
### 🛡️ Strategic Operational Scenarios:
* **Scenario A — Continuation to Macro Resistance Ceiling:** Holding above the **8,281.2** (0.236 Fibo) level on a daily close basis validates Wave (5) continuation toward the primary major high resistance wall at **8,907.5** (0 Fibo Peak).
* **Scenario B — Post-Impulse ABC Correction:** A rejection at the top channel line may signal wave completion, triggering a secondary corrective consolidation back toward the **7,890.9** (0.382 Fibo) support floor.
### 📊 Tactical Parameters Summary:
* **Current Bias:** Strongly Bullish / Wave (5) Completion Phase
* **Immediate Dynamic Support (0.236 Fibo):** 8,281.2
* **Secondary Structural Base (0.382 Fibo):** 7,890.9
* **Macro Overhead Target Ceiling (0 Fibo Peak):** 8,907.5
* **Institutional Risk Baseline (200-EMA):** 7,410.9
---
📊 **ChartPro Data**
*Soft Commodities Architecture, Elliott Wave Mechanics & Systematic Risk Management.*
⚠️ **Disclaimer:** For educational and informational purposes only. This active market study represents a personal trading framework and does not constitute financial or investment advice.
COTTON) Daily: 5-Wave Elliott Impulse Advances Towards 8,907 Macro Ceiling Following 0.618 Fibo Rebound### 🌾 Cotton No. 2 CFD (
COTTON) Daily Technical Matrix (Ref: COTTON_2026-08-06_08-56-13.png)We are releasing a Daily (1D) Elliott Wave structural framework on Cotton No. 2 (
COTTON). Following a clean technical reaction off key multi-confluence support inside the highlighted green circle, price action has been executing a textbook 5-wave motive impulse within an ascending parallel channel.The commodity is currently trading around **8,362.5 (-0.03%)**, pressing above the **0.236 Fibonacci retracement level at 8,281.2**.
---
### 🔍 Technical Architecture & Wave Structure Analysis:
Our quantitative setup isolates the mechanical progression of this bullish cycle:
1. **Foundational Launchpad (Green Circle Confluence):** The primary structural bottom (Wave 2 pivot) was anchored at the confluence of the **0.618 Golden Ratio Fibonacci level (7,260.1)**, the horizontal static support line (**7,288.3**), and the institutional **200-period EMA (purple line at 7,410.9)**.
2. **5-Wave Impulse Progression (Blue Vector Corridor):**
* **Waves (1) & (2):** Initial directional breakout followed by a higher-low correction off dynamic channel support.
* **Waves (3) & (4):** Extended expansion leg testing **8,281.2**, followed by a controlled pullback holding the **0.382 Fibonacci retracement node (7,890.9)**.
* **Wave (5) Terminal Leg:** Active impulse driving price action toward the upper ascending boundary of the blue channel.
---
### 🛡️ Strategic Operational Scenarios:
* **Scenario A — Continuation to Macro Resistance Ceiling:** Holding above the **8,281.2** (0.236 Fibo) level on a daily close basis validates Wave (5) continuation toward the primary major high resistance wall at **8,907.5** (0 Fibo Peak).
* **Scenario B — Post-Impulse ABC Correction:** A rejection at the top channel line may signal wave completion, triggering a secondary corrective consolidation back toward the **7,890.9** (0.382 Fibo) support floor.
### 📊 Tactical Parameters Summary:
* **Current Bias:** Strongly Bullish / Wave (5) Completion Phase
* **Immediate Dynamic Support (0.236 Fibo):** 8,281.2
* **Secondary Structural Base (0.382 Fibo):** 7,890.9
* **Macro Overhead Target Ceiling (0 Fibo Peak):** 8,907.5
* **Institutional Risk Baseline (200-EMA):** 7,410.9
---
📊 **ChartPro Data**
*Soft Commodities Architecture, Elliott Wave Mechanics & Systematic Risk Management.*
⚠️ **Disclaimer:** For educational and informational purposes only. This active market study represents a personal trading framework and does not constitute financial or investment advice.

Feragatname
Bilgiler ve yayınlar, TradingView tarafından sağlanan veya onaylanan finansal, yatırım, alım satım veya diğer türden tavsiye veya öneriler anlamına gelmez ve teşkil etmez. Kullanım Koşulları bölümünde daha fazlasını okuyun.
Feragatname
Bilgiler ve yayınlar, TradingView tarafından sağlanan veya onaylanan finansal, yatırım, alım satım veya diğer türden tavsiye veya öneriler anlamına gelmez ve teşkil etmez. Kullanım Koşulları bölümünde daha fazlasını okuyun.