
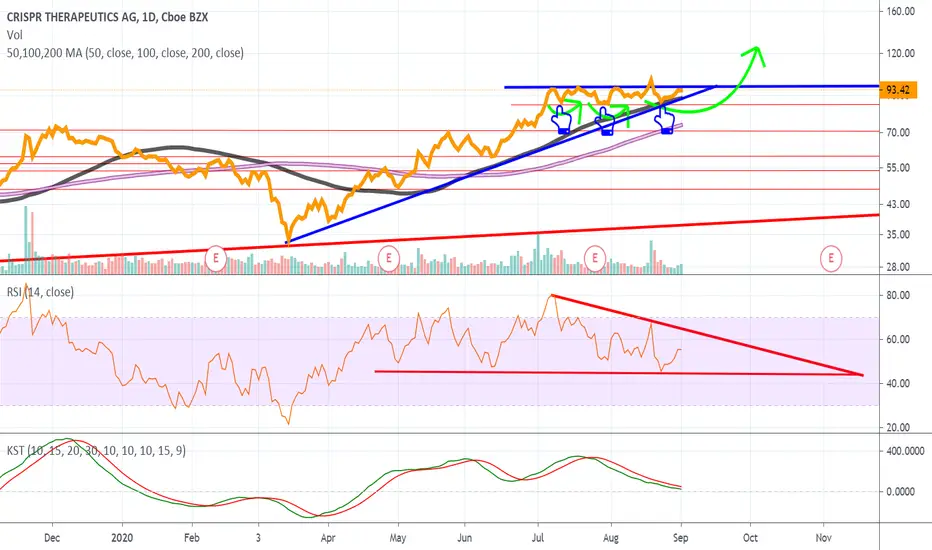
Notice the dark blue pattern on the chart, there's noticeably a Ascending Triangle and coincidentally a bullish inverted H&S where I have placed the green lines.
Above each green line is appears to be a bottom, and there's three very noticeable on the line chart as opposed to the hollow candle chart. I have placed three blue finger icons so there is no confusion, each finger represents a bottom of the Triple Bottom.
On the RSI there's was clearly a modest divergence, if the Ascending Triangle breakout to the upside the RSI is going to need to create a higher high and break out of the pattern to the upside negating the possibility of this ending in a bearish divergence & descending triangle.
Above each green line is appears to be a bottom, and there's three very noticeable on the line chart as opposed to the hollow candle chart. I have placed three blue finger icons so there is no confusion, each finger represents a bottom of the Triple Bottom.
On the RSI there's was clearly a modest divergence, if the Ascending Triangle breakout to the upside the RSI is going to need to create a higher high and break out of the pattern to the upside negating the possibility of this ending in a bearish divergence & descending triangle.

İlgili yayınlar
Feragatname
Bilgiler ve yayınlar, TradingView tarafından sağlanan veya onaylanan finansal, yatırım, alım satım veya diğer türden tavsiye veya öneriler anlamına gelmez ve teşkil etmez. Kullanım Koşulları bölümünde daha fazlasını okuyun.
Feragatname
Bilgiler ve yayınlar, TradingView tarafından sağlanan veya onaylanan finansal, yatırım, alım satım veya diğer türden tavsiye veya öneriler anlamına gelmez ve teşkil etmez. Kullanım Koşulları bölümünde daha fazlasını okuyun.