
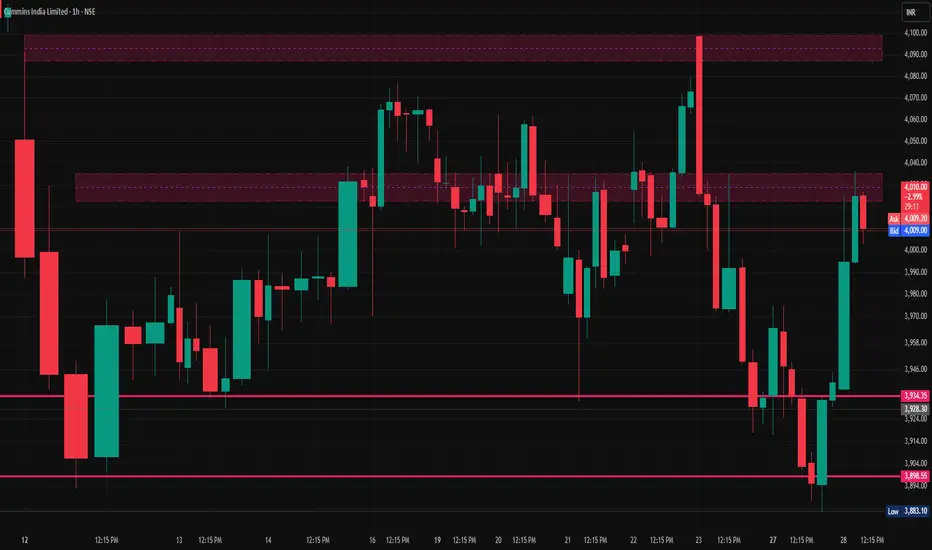
📌 Current Price Snapshot (Indicative, ~28 Jan 2026 mid‑session)
Approx Price: ₹4,004 – ₹4,016 on NSE (delayed/real‑time range)
📍 1‑Hour Time Frame / Intraday Pivot Levels
Pivot levels help identify key zones where price may react during the current session.
Central Pivot (CP)
CP (Pivot): ~₹3,928 – ₹3,929 (hourly reference)
🔼 Resistance Levels (Upside)
R1: ~₹4,020 – ₹4,021 — first major upside cap above pivot
R2: ~₹4,066 – ₹4,067 — next resistance zone from pivot calculations
R3: ~₹4,100 – ₹4,110 — broader extension resistance (calculated range)
🔽 Support Levels (Downside)
S1: ~₹3,902 – ₹3,903 — immediate support below pivot
S2: ~₹3,882 – ₹3,883 — secondary support zone
S3: ~₹3,790 – ₹3,791 — deeper support if price drops sharply
📈 Notes
🔹 These pivot levels are derived from intraday pivot calculations (Standard / Fibonacci / Camarilla methods) updated recently for the current session.
🔹 The current price is indicative and may be slightly delayed vs live feed – for ultra‑precise trading, use your broker chart with 1‑hour timeframe.
🔹 Support/resistance bands change as price moves; always verify on live charts.
Approx Price: ₹4,004 – ₹4,016 on NSE (delayed/real‑time range)
📍 1‑Hour Time Frame / Intraday Pivot Levels
Pivot levels help identify key zones where price may react during the current session.
Central Pivot (CP)
CP (Pivot): ~₹3,928 – ₹3,929 (hourly reference)
🔼 Resistance Levels (Upside)
R1: ~₹4,020 – ₹4,021 — first major upside cap above pivot
R2: ~₹4,066 – ₹4,067 — next resistance zone from pivot calculations
R3: ~₹4,100 – ₹4,110 — broader extension resistance (calculated range)
🔽 Support Levels (Downside)
S1: ~₹3,902 – ₹3,903 — immediate support below pivot
S2: ~₹3,882 – ₹3,883 — secondary support zone
S3: ~₹3,790 – ₹3,791 — deeper support if price drops sharply
📈 Notes
🔹 These pivot levels are derived from intraday pivot calculations (Standard / Fibonacci / Camarilla methods) updated recently for the current session.
🔹 The current price is indicative and may be slightly delayed vs live feed – for ultra‑precise trading, use your broker chart with 1‑hour timeframe.
🔹 Support/resistance bands change as price moves; always verify on live charts.

İlgili yayınlar
Feragatname
Bilgiler ve yayınlar, TradingView tarafından sağlanan veya onaylanan finansal, yatırım, alım satım veya diğer türden tavsiye veya öneriler anlamına gelmez ve teşkil etmez. Kullanım Koşulları bölümünde daha fazlasını okuyun.
İlgili yayınlar
Feragatname
Bilgiler ve yayınlar, TradingView tarafından sağlanan veya onaylanan finansal, yatırım, alım satım veya diğer türden tavsiye veya öneriler anlamına gelmez ve teşkil etmez. Kullanım Koşulları bölümünde daha fazlasını okuyun.