
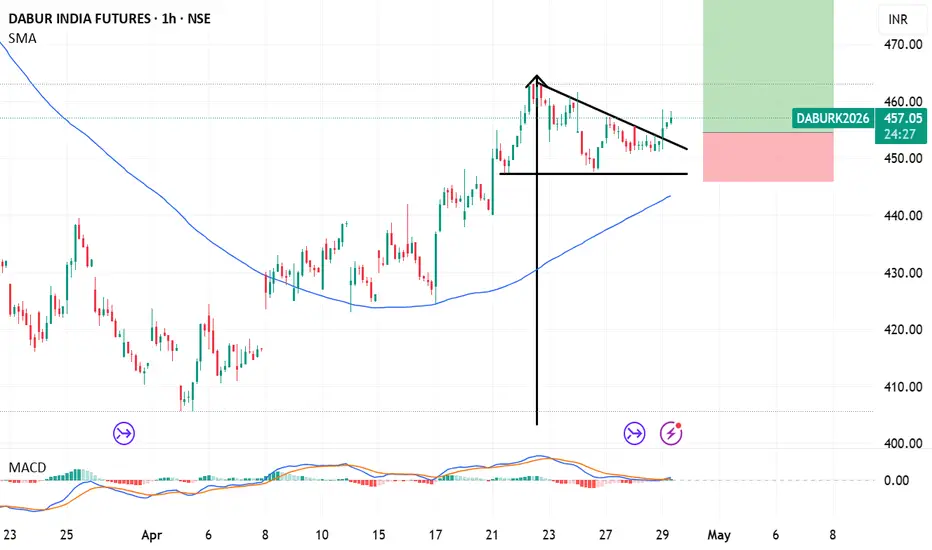
Dabur India Futures (DABUR) has been showing signs of consolidation and potential base-building, with analysts noting technical signals that could indicate a reversal, including a potential flag pattern on lower timeframes.
The stock has been attempting to form a base in the ₹440–₹465 range.
Action: Potential Long/Buy
Target (T1): ₹485 (Based on pattern breakout projection)
Stop Loss (SL): ₹445 (Below immediate support levels)
Key Support to Watch: ₹446–₹449
Key Resistance to Break: ₹461–₹463
The stock has been attempting to form a base in the ₹440–₹465 range.
Action: Potential Long/Buy
Target (T1): ₹485 (Based on pattern breakout projection)
Stop Loss (SL): ₹445 (Below immediate support levels)
Key Support to Watch: ₹446–₹449
Key Resistance to Break: ₹461–₹463
İşlem kapandı: durdurma seviyesi

Feragatname
Bilgiler ve yayınlar, TradingView tarafından sağlanan veya onaylanan finansal, yatırım, alım satım veya diğer türden tavsiye veya öneriler anlamına gelmez ve teşkil etmez. Kullanım Koşulları bölümünde daha fazlasını okuyun.
Feragatname
Bilgiler ve yayınlar, TradingView tarafından sağlanan veya onaylanan finansal, yatırım, alım satım veya diğer türden tavsiye veya öneriler anlamına gelmez ve teşkil etmez. Kullanım Koşulları bölümünde daha fazlasını okuyun.