
1. The Macro Perspective: The Multi-Month Accumulation Base
I am taking a LONG bias on Delta Air Lines, Inc. (DAL) on the weekly (1W) timeframe.
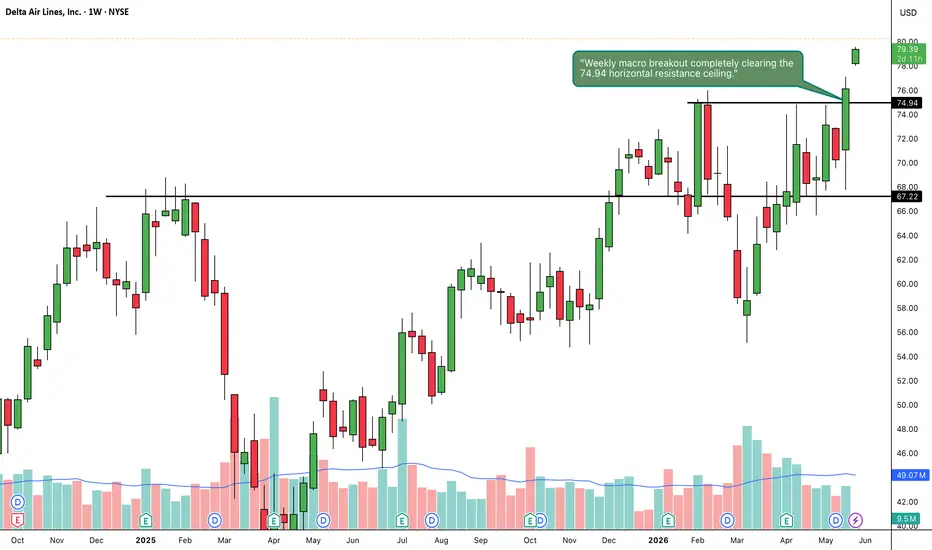
When analyzing pure market structure on a major airline, prolonged consolidation periods often precede significant trend continuations. Looking at the chart, after a strong recovery phase, DAL entered a multi-month sideways accumulation block throughout early 2026. This structure was tightly bounded by a solid structural floor near 67.22 and a heavy overhead resistance ceiling at 74.94. This sideways digestion effectively absorbed profit-taking and allowed institutional buyers to quietly accumulate shares. Fundamentally, this strong technical momentum aligns with Delta's recent Q1 2026 financial performance; the airline reported a record March quarter adjusted operating revenue of $14.2 billion, which was up 9.4% year-over-year. Furthermore, the company delivered non-GAAP earnings of $0.64 per share, beating the forecast of $0.61.
2. The Educational Setup: Horizontal Boundary Defense
To understand the absolute technical validity behind this macro launch, look closely at how the price structure interacted with its core horizontal boundaries right before breaking out:
The 74.94 Resistance Ceiling: The definitive line in the sand for a bullish continuation was the solid black horizontal resistance line drawn at 74.94. As the price tested this line multiple times since February 2026, it established a clear, heavy supply zone that systematically rejected upward expansion.
The 67.22 Structural Floor: During the consolidation block, sellers repeatedly tried to push the price lower but were aggressively halted at the 67.22 support line. This created a robust, unbreakable accumulation floor where strong-handed portfolios absorbed floating supply.
3. Current Price Action: Breakout and Volatility Expansion
Look at the most recent weekly candle on the far right of the chart. The structural pressure cooker has officially exploded. Institutional buyers have stepped in with undeniable conviction, printing a massive, full-bodied green expansion candle that has vertically surged to 79.39. This explosive thrust has decisively obliterated the 74.94 multi-month ceiling. This breakout occurred despite some recent operational headwinds, where on May 26, 2026, Delta faced a rise in domestic flight cancellations exceeding the industry average due to adverse weather and air traffic control issues. The market is clearly looking past these short-term disruptions, focusing instead on the airline's strong structural demand and transitioning into a high-volatility markup trend.
4. The Trade Plan: Entries, Targets, and Risk Management
Entry Strategy: Momentum is exceptionally strong with the stock trading vertically out in the open. Chasing a breakout candle immediately carries a minor risk of a short-term, lower-timeframe mean-reversion pullback. The highest-probability, lowest-risk entry strategy involves stepping down to the daily timeframe and waiting for the initial vertical excitement to cool off. Look to scale into long positions or place limit orders to catch a potential pullback to perfectly retest the broken 73.00 to 75.00 prior resistance zone. Letting old historical resistance prove itself as a concrete new support floor provides an unmatched risk-to-reward ratio.
Take Profit (Targets): By taking the absolute depth of the horizontal accumulation range (roughly 7.7 points from the 67.22 floor up to the 74.94 ceiling) and projecting it upward from the breakout point, our primary structural macro target sits comfortably in the 82.50 to 83.50 zone over the coming weeks.
Invalidation (Stop Loss): An explosive macro breakout thesis is completely invalidated if the price fails to hold its newly claimed structural floor and collapses back inside the core of the base boundaries. A hard stop loss should be placed safely below the recent weekly swing lows, specifically around the 65.00 to 67.00 level. A definitive weekly close completely back below 67.00 would act as a severe warning sign of a failed macro breakout and a major bull trap. Additionally, investors should monitor insider activity, as over the past three months, insiders have sold $14.3 million in shares with no reported buying activity.
5. Time Horizon:
Because this technical setup is built on a 1-Week chart capturing a massive structural phase transition and a clean horizontal breakout, this is a medium-term position trade designed to capture a secular markup phase over the coming weeks and months. Let the macro trend run!
I am taking a LONG bias on Delta Air Lines, Inc. (DAL) on the weekly (1W) timeframe.
When analyzing pure market structure on a major airline, prolonged consolidation periods often precede significant trend continuations. Looking at the chart, after a strong recovery phase, DAL entered a multi-month sideways accumulation block throughout early 2026. This structure was tightly bounded by a solid structural floor near 67.22 and a heavy overhead resistance ceiling at 74.94. This sideways digestion effectively absorbed profit-taking and allowed institutional buyers to quietly accumulate shares. Fundamentally, this strong technical momentum aligns with Delta's recent Q1 2026 financial performance; the airline reported a record March quarter adjusted operating revenue of $14.2 billion, which was up 9.4% year-over-year. Furthermore, the company delivered non-GAAP earnings of $0.64 per share, beating the forecast of $0.61.
2. The Educational Setup: Horizontal Boundary Defense
To understand the absolute technical validity behind this macro launch, look closely at how the price structure interacted with its core horizontal boundaries right before breaking out:
The 74.94 Resistance Ceiling: The definitive line in the sand for a bullish continuation was the solid black horizontal resistance line drawn at 74.94. As the price tested this line multiple times since February 2026, it established a clear, heavy supply zone that systematically rejected upward expansion.
The 67.22 Structural Floor: During the consolidation block, sellers repeatedly tried to push the price lower but were aggressively halted at the 67.22 support line. This created a robust, unbreakable accumulation floor where strong-handed portfolios absorbed floating supply.
3. Current Price Action: Breakout and Volatility Expansion
Look at the most recent weekly candle on the far right of the chart. The structural pressure cooker has officially exploded. Institutional buyers have stepped in with undeniable conviction, printing a massive, full-bodied green expansion candle that has vertically surged to 79.39. This explosive thrust has decisively obliterated the 74.94 multi-month ceiling. This breakout occurred despite some recent operational headwinds, where on May 26, 2026, Delta faced a rise in domestic flight cancellations exceeding the industry average due to adverse weather and air traffic control issues. The market is clearly looking past these short-term disruptions, focusing instead on the airline's strong structural demand and transitioning into a high-volatility markup trend.
4. The Trade Plan: Entries, Targets, and Risk Management
Entry Strategy: Momentum is exceptionally strong with the stock trading vertically out in the open. Chasing a breakout candle immediately carries a minor risk of a short-term, lower-timeframe mean-reversion pullback. The highest-probability, lowest-risk entry strategy involves stepping down to the daily timeframe and waiting for the initial vertical excitement to cool off. Look to scale into long positions or place limit orders to catch a potential pullback to perfectly retest the broken 73.00 to 75.00 prior resistance zone. Letting old historical resistance prove itself as a concrete new support floor provides an unmatched risk-to-reward ratio.
Take Profit (Targets): By taking the absolute depth of the horizontal accumulation range (roughly 7.7 points from the 67.22 floor up to the 74.94 ceiling) and projecting it upward from the breakout point, our primary structural macro target sits comfortably in the 82.50 to 83.50 zone over the coming weeks.
Invalidation (Stop Loss): An explosive macro breakout thesis is completely invalidated if the price fails to hold its newly claimed structural floor and collapses back inside the core of the base boundaries. A hard stop loss should be placed safely below the recent weekly swing lows, specifically around the 65.00 to 67.00 level. A definitive weekly close completely back below 67.00 would act as a severe warning sign of a failed macro breakout and a major bull trap. Additionally, investors should monitor insider activity, as over the past three months, insiders have sold $14.3 million in shares with no reported buying activity.
5. Time Horizon:
Because this technical setup is built on a 1-Week chart capturing a massive structural phase transition and a clean horizontal breakout, this is a medium-term position trade designed to capture a secular markup phase over the coming weeks and months. Let the macro trend run!
İşlem kapandı: hedefe ulaştı
Target already achieved
Feragatname
Bilgiler ve yayınlar, TradingView tarafından sağlanan veya onaylanan finansal, yatırım, alım satım veya diğer türden tavsiye veya öneriler anlamına gelmez ve teşkil etmez. Kullanım Koşulları bölümünde daha fazlasını okuyun.
Feragatname
Bilgiler ve yayınlar, TradingView tarafından sağlanan veya onaylanan finansal, yatırım, alım satım veya diğer türden tavsiye veya öneriler anlamına gelmez ve teşkil etmez. Kullanım Koşulları bölümünde daha fazlasını okuyun.