
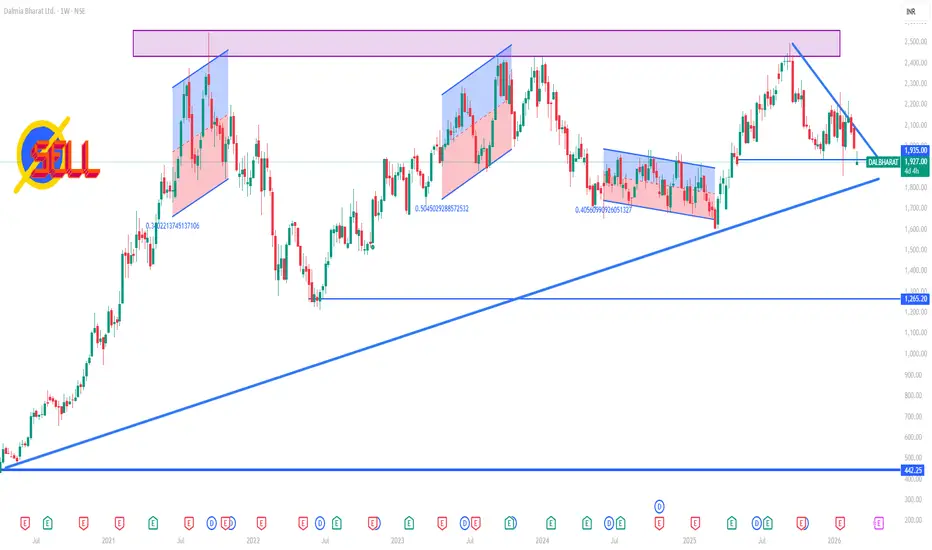
📌 Live Share Price (approximate)
Current price is around ₹1,990–₹2,000 on NSE (latest trading session data).
Note: Prices fluctuate throughout the trading day — this reflects recent end-session data.
📈 Weekly Support & Resistance Levels (1-Week Timeframe)
🔹 Immediate Weekly Resistance Zones
1️⃣ ~₹2,150–₹2,160 – Short-term upside hurdle (near weekly pivot resistance).
2️⃣ ~₹2,180–₹2,210 – Secondary resistance if above the first level.
3️⃣ ~₹2,280–₹2,300 – Higher resistance zone on a strong breakout.
🔸 Immediate Weekly Support Zones
1️⃣ ~₹2,030–₹2,070 – First support pivot area.
2️⃣ ~₹2,000 (psychological & pivot floor) – crucial near the current price.
3️⃣ ~₹1,900–₹1,920 – Deeper support if weekly losses extend.
📊 Weekly Technical Observations
Weekly pivot analysis suggests that closing above ~₹2,198–₹2,210 could accelerate upside towards ₹2,280+ resistance.
On the downside, a break below ~₹2,009–₹2,030 may test ~₹1,900 and then ₹1,820 as lower weekly support zones.
📌 How to Use These Levels in a Weekly Context
✔ Bullish scenario: Above ₹2,150–₹2,180 → next targets ~₹2,280+
✔ Neutral / Range: ₹2,030–₹2,150 → trading sideways
✔ Bearish scenario: Below ₹2,000 → risk of ₹1,900 / ₹1,820 tests
Current price is around ₹1,990–₹2,000 on NSE (latest trading session data).
Note: Prices fluctuate throughout the trading day — this reflects recent end-session data.
📈 Weekly Support & Resistance Levels (1-Week Timeframe)
🔹 Immediate Weekly Resistance Zones
1️⃣ ~₹2,150–₹2,160 – Short-term upside hurdle (near weekly pivot resistance).
2️⃣ ~₹2,180–₹2,210 – Secondary resistance if above the first level.
3️⃣ ~₹2,280–₹2,300 – Higher resistance zone on a strong breakout.
🔸 Immediate Weekly Support Zones
1️⃣ ~₹2,030–₹2,070 – First support pivot area.
2️⃣ ~₹2,000 (psychological & pivot floor) – crucial near the current price.
3️⃣ ~₹1,900–₹1,920 – Deeper support if weekly losses extend.
📊 Weekly Technical Observations
Weekly pivot analysis suggests that closing above ~₹2,198–₹2,210 could accelerate upside towards ₹2,280+ resistance.
On the downside, a break below ~₹2,009–₹2,030 may test ~₹1,900 and then ₹1,820 as lower weekly support zones.
📌 How to Use These Levels in a Weekly Context
✔ Bullish scenario: Above ₹2,150–₹2,180 → next targets ~₹2,280+
✔ Neutral / Range: ₹2,030–₹2,150 → trading sideways
✔ Bearish scenario: Below ₹2,000 → risk of ₹1,900 / ₹1,820 tests

Contact Knowledgehub for a detailed consultation: Dm on WhatsApp: [wa.link/a2o0kz]-
Phone No: [+91 93102 26243]-
Email: [tradingviewknowledgehub@gmail.com]---
-- Let’s achieve success together!
Phone No: [+91 93102 26243]-
Email: [tradingviewknowledgehub@gmail.com]---
-- Let’s achieve success together!
İlgili yayınlar
Feragatname
Bilgiler ve yayınlar, TradingView tarafından sağlanan veya onaylanan finansal, yatırım, alım satım veya diğer türden tavsiye veya öneriler anlamına gelmez ve teşkil etmez. Kullanım Koşulları bölümünde daha fazlasını okuyun.
Contact Knowledgehub for a detailed consultation: Dm on WhatsApp: [wa.link/a2o0kz]-
Phone No: [+91 93102 26243]-
Email: [tradingviewknowledgehub@gmail.com]---
-- Let’s achieve success together!
Phone No: [+91 93102 26243]-
Email: [tradingviewknowledgehub@gmail.com]---
-- Let’s achieve success together!
İlgili yayınlar
Feragatname
Bilgiler ve yayınlar, TradingView tarafından sağlanan veya onaylanan finansal, yatırım, alım satım veya diğer türden tavsiye veya öneriler anlamına gelmez ve teşkil etmez. Kullanım Koşulları bölümünde daha fazlasını okuyun.