
With oil's breakout and many energy stocks nearing major breakout levels, it is important to take a look at DBC, the Invesco DB Commodity Index Tracking Fund.
DBC is one of the largest and most widely held broad commodity ETFs. Rather than tracking a single commodity, it holds a diversified basket of 14 futures contracts spanning energy, metals, and agriculture, including WTI crude, Brent crude, heating oil, RBOB gasoline, natural gas, gold, silver, aluminum, zinc, copper, corn, wheat, soybeans, and sugar.
This makes DBC essentially a broad snapshot of the entire commodity complex in a single chart. When DBC starts moving to the upside, it typically signals that inflationary pressure and demand are building broadly across raw materials, not just in a single sector.
Nearing a Historic Level
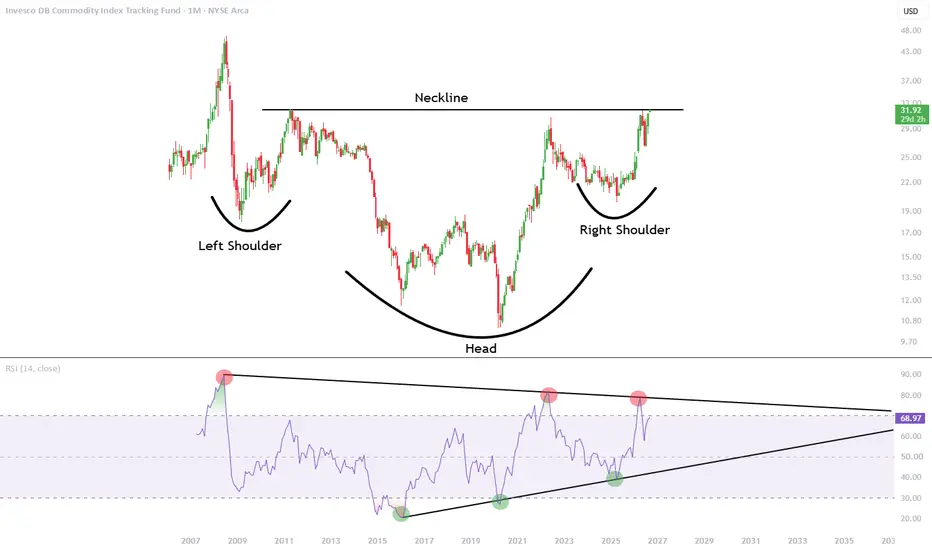
Right now, the index is nearing levels last seen in 2011. The high in May 2011 printed at $32.02, and price is currently trading right around that same level, with a recent high today of $31.94.
The Current Pattern
This is crucial to understand, because this $32 level is starting to look like the neckline of a massive inverse Head and Shoulders pattern.
The left shoulder formed around the $18 lows in 2009. The head formed during the COVID collapse, with a low around $10. Finally, the right shoulder formed around $20 in 2025. Now that price is nearing the neckline, it could be preparing to accelerate alongside all the other breakouts currently forming across the energy and commodity sector.
The Monthly RSI
At the same time, it is important to examine the monthly RSI. August's monthly candle just closed with an RSI reading around 68, getting very close to overbought conditions at 70.
Throughout the entire tracked history of this index, the RSI has been forming a massive triangle pattern in terms of trend strength. The extreme tops in strength are marked with red circles, and the extreme lows in strength are marked with green circles. This is a monthly chart, so this structure will take a considerable amount of time to fully develop and confirm, but is vital to be paying attention to.
What a Breakout Would Actually Mean
A confirmed breakout on this chart would be significant well beyond just this single fund. Since DBC tracks a broad basket of essential raw materials, energy, metals, and agriculture combined, a genuine breakout would suggest sustained inflationary pressure building across the global economy, not just within a single commodity like oil. Given how directly commodity prices feed into consumer costs, transportation, food, and manufacturing, a multi year breakout on this index would be an early signal worth watching closely for its broader implications on inflation and monetary policy going forward.
DBC is one of the largest and most widely held broad commodity ETFs. Rather than tracking a single commodity, it holds a diversified basket of 14 futures contracts spanning energy, metals, and agriculture, including WTI crude, Brent crude, heating oil, RBOB gasoline, natural gas, gold, silver, aluminum, zinc, copper, corn, wheat, soybeans, and sugar.
This makes DBC essentially a broad snapshot of the entire commodity complex in a single chart. When DBC starts moving to the upside, it typically signals that inflationary pressure and demand are building broadly across raw materials, not just in a single sector.
Nearing a Historic Level
Right now, the index is nearing levels last seen in 2011. The high in May 2011 printed at $32.02, and price is currently trading right around that same level, with a recent high today of $31.94.
The Current Pattern
This is crucial to understand, because this $32 level is starting to look like the neckline of a massive inverse Head and Shoulders pattern.
The left shoulder formed around the $18 lows in 2009. The head formed during the COVID collapse, with a low around $10. Finally, the right shoulder formed around $20 in 2025. Now that price is nearing the neckline, it could be preparing to accelerate alongside all the other breakouts currently forming across the energy and commodity sector.
The Monthly RSI
At the same time, it is important to examine the monthly RSI. August's monthly candle just closed with an RSI reading around 68, getting very close to overbought conditions at 70.
Throughout the entire tracked history of this index, the RSI has been forming a massive triangle pattern in terms of trend strength. The extreme tops in strength are marked with red circles, and the extreme lows in strength are marked with green circles. This is a monthly chart, so this structure will take a considerable amount of time to fully develop and confirm, but is vital to be paying attention to.
What a Breakout Would Actually Mean
A confirmed breakout on this chart would be significant well beyond just this single fund. Since DBC tracks a broad basket of essential raw materials, energy, metals, and agriculture combined, a genuine breakout would suggest sustained inflationary pressure building across the global economy, not just within a single commodity like oil. Given how directly commodity prices feed into consumer costs, transportation, food, and manufacturing, a multi year breakout on this index would be an early signal worth watching closely for its broader implications on inflation and monetary policy going forward.

Feragatname
Bilgiler ve yayınlar, TradingView tarafından sağlanan veya onaylanan finansal, yatırım, alım satım veya diğer türden tavsiye veya öneriler anlamına gelmez ve teşkil etmez. Kullanım Koşulları bölümünde daha fazlasını okuyun.
Feragatname
Bilgiler ve yayınlar, TradingView tarafından sağlanan veya onaylanan finansal, yatırım, alım satım veya diğer türden tavsiye veya öneriler anlamına gelmez ve teşkil etmez. Kullanım Koşulları bölümünde daha fazlasını okuyun.