
1. The Macro Perspective: The Brutal Washout and Recovery
I am taking a LONG bias on Datadog, Inc. (DDOG) on the absolute macro monthly (1M) timeframe.
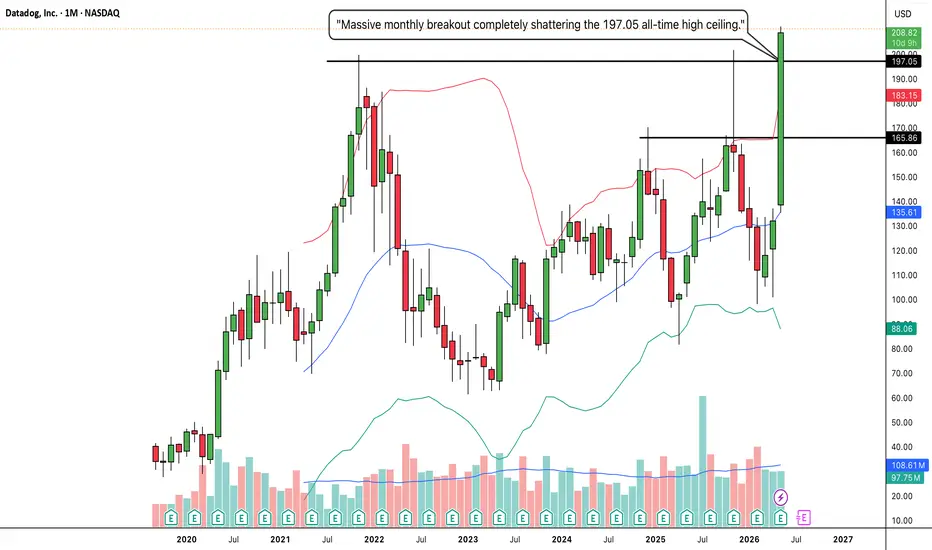
When analyzing pure market structure on a monthly chart, we are looking at cycles that take years to play out. Look at the massive structural development spanning this entire chart. After establishing a historical peak at the solid black 197.05 line, the stock suffered a brutal, agonizing markdown phase. This deep correction successfully washed out weak hands and forced mass retail capitulation, dragging the price all the way down into the 60s. However, instead of bleeding into a permanent bear market, heavy institutional capital stepped in to establish a concrete floor. Over the last two years, the stock has been quietly carving out an enormous "Rounding Bottom" accumulation phase, systematically riding the 20 SMA (the middle Bollinger Band) to march right back up the chart.
2. The Educational Setup: Conquering the Stepping Stones
To understand the sheer strength of this current breakout, look at how the price systematically transitioned from accumulation back into a markup phase:
The Mid-Level Digestion: The stock's recovery initially faced heavy resistance at the solid black 165.86 line. Instead of suffering a massive rejection, it paused, digested the supply, and formed a high-level consolidation right at the moving average.
The Institutional Urgency: When institutional capital decides it is time to move, they don't wait. Buyers used that mid-level digestion as a launchpad, creating an aggressive, near-vertical surge that refused to give sellers a chance to breathe.
3. Current Price Action: Blue Sky and Volatility Expansion
Look at the most recent monthly candle on the far right. The momentum is absolutely explosive. Buyers have effortlessly shattered both the 165.86 stepping stone and the 197.05 ultimate macro ceiling in a single, massive momentum expansion candle. Furthermore, notice how the price has violently pierced the upper Bollinger Band, forcing the bands to rapidly expand. By decisively clearing this multi-year accumulation zone, DDOG has officially entered "Blue Sky Territory" (pure price discovery). All historical overhead supply has been completely eliminated.
4. The Trade Plan: Entries, Targets, and Risk Management
Entry Strategy: Momentum is exceptionally strong right now near 208.82. Chasing a massive vertical expansion candle riding completely outside the monthly Bollinger Bands carries a severe risk of an agonizing drawdown as the stock naturally breathes. The highest-probability, lowest-risk entry involves stepping down to a weekly or daily timeframe and waiting for the dust to settle. Look to place limit orders to catch a potential minor structural pullback to perfectly retest the 195.00 to 200.00 breakout zone. Letting that old all-time high resistance prove itself as a new, indestructible support floor offers a phenomenal risk-to-reward ratio.
Take Profit (Targets): We use measured structural targets based on the depth of the macro base. By taking the depth of the massive Rounding Bottom (roughly 130 points from the ~65 floor up to the 197.05 ceiling) and projecting it upward from the breakout line, our primary structural macro target sits comfortably in the 325.00 to 330.00 zone. Immediate psychological milestones are 250.00 and 300.00.
Invalidation (Stop Loss): A macro breakout thesis is only valid if the new market structure holds. A hard stop loss should be placed safely below the 197.05 breakout line and the 165.86 mid-level pivot, around the 150.00 to 155.00 level. A definitive monthly close completely back inside the old accumulation base would act as a massive warning sign of a failed macro breakout and a severe bull trap.
5. Time Horizon:
Because this technical setup is built on a 1-Month chart capturing a massive structural phase transition and All-Time High breakout, this is a long-term position trade designed to capture a secular markup phase over the coming months. Let the macro trend run!
I am taking a LONG bias on Datadog, Inc. (DDOG) on the absolute macro monthly (1M) timeframe.
When analyzing pure market structure on a monthly chart, we are looking at cycles that take years to play out. Look at the massive structural development spanning this entire chart. After establishing a historical peak at the solid black 197.05 line, the stock suffered a brutal, agonizing markdown phase. This deep correction successfully washed out weak hands and forced mass retail capitulation, dragging the price all the way down into the 60s. However, instead of bleeding into a permanent bear market, heavy institutional capital stepped in to establish a concrete floor. Over the last two years, the stock has been quietly carving out an enormous "Rounding Bottom" accumulation phase, systematically riding the 20 SMA (the middle Bollinger Band) to march right back up the chart.
2. The Educational Setup: Conquering the Stepping Stones
To understand the sheer strength of this current breakout, look at how the price systematically transitioned from accumulation back into a markup phase:
The Mid-Level Digestion: The stock's recovery initially faced heavy resistance at the solid black 165.86 line. Instead of suffering a massive rejection, it paused, digested the supply, and formed a high-level consolidation right at the moving average.
The Institutional Urgency: When institutional capital decides it is time to move, they don't wait. Buyers used that mid-level digestion as a launchpad, creating an aggressive, near-vertical surge that refused to give sellers a chance to breathe.
3. Current Price Action: Blue Sky and Volatility Expansion
Look at the most recent monthly candle on the far right. The momentum is absolutely explosive. Buyers have effortlessly shattered both the 165.86 stepping stone and the 197.05 ultimate macro ceiling in a single, massive momentum expansion candle. Furthermore, notice how the price has violently pierced the upper Bollinger Band, forcing the bands to rapidly expand. By decisively clearing this multi-year accumulation zone, DDOG has officially entered "Blue Sky Territory" (pure price discovery). All historical overhead supply has been completely eliminated.
4. The Trade Plan: Entries, Targets, and Risk Management
Entry Strategy: Momentum is exceptionally strong right now near 208.82. Chasing a massive vertical expansion candle riding completely outside the monthly Bollinger Bands carries a severe risk of an agonizing drawdown as the stock naturally breathes. The highest-probability, lowest-risk entry involves stepping down to a weekly or daily timeframe and waiting for the dust to settle. Look to place limit orders to catch a potential minor structural pullback to perfectly retest the 195.00 to 200.00 breakout zone. Letting that old all-time high resistance prove itself as a new, indestructible support floor offers a phenomenal risk-to-reward ratio.
Take Profit (Targets): We use measured structural targets based on the depth of the macro base. By taking the depth of the massive Rounding Bottom (roughly 130 points from the ~65 floor up to the 197.05 ceiling) and projecting it upward from the breakout line, our primary structural macro target sits comfortably in the 325.00 to 330.00 zone. Immediate psychological milestones are 250.00 and 300.00.
Invalidation (Stop Loss): A macro breakout thesis is only valid if the new market structure holds. A hard stop loss should be placed safely below the 197.05 breakout line and the 165.86 mid-level pivot, around the 150.00 to 155.00 level. A definitive monthly close completely back inside the old accumulation base would act as a massive warning sign of a failed macro breakout and a severe bull trap.
5. Time Horizon:
Because this technical setup is built on a 1-Month chart capturing a massive structural phase transition and All-Time High breakout, this is a long-term position trade designed to capture a secular markup phase over the coming months. Let the macro trend run!
İşlem kapandı: durdurma seviyesi
Target already achieved.
Feragatname
Bilgiler ve yayınlar, TradingView tarafından sağlanan veya onaylanan finansal, yatırım, alım satım veya diğer türden tavsiye veya öneriler anlamına gelmez ve teşkil etmez. Kullanım Koşulları bölümünde daha fazlasını okuyun.
Feragatname
Bilgiler ve yayınlar, TradingView tarafından sağlanan veya onaylanan finansal, yatırım, alım satım veya diğer türden tavsiye veya öneriler anlamına gelmez ve teşkil etmez. Kullanım Koşulları bölümünde daha fazlasını okuyun.