
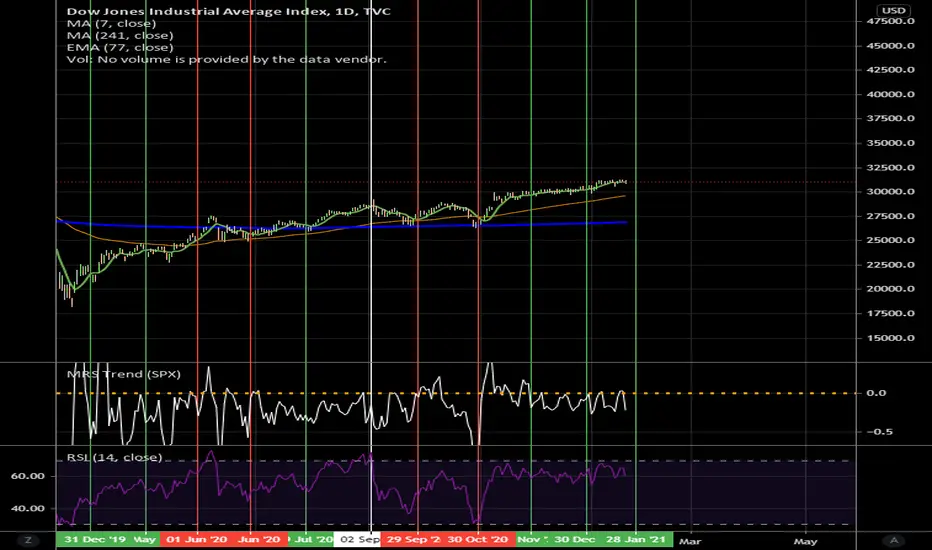
This is an analyzation Yale Hirsch's book "Don't Sell Stocks on Monday" in which he defines stock markets high/low months over the past 100 years.
High Months: January, March, April, July, November December
Low Months: February, May, June, August, September, October
Green Lines mark Positive Correlation with High Months
Red Lines mark Positive Correlation with Low Months
White Lines mark no Correlation for the month.
8 times out of the past 3 years the averages were wrong for an %80 accuracy.
High Months: January, March, April, July, November December
Low Months: February, May, June, August, September, October
Green Lines mark Positive Correlation with High Months
Red Lines mark Positive Correlation with Low Months
White Lines mark no Correlation for the month.
8 times out of the past 3 years the averages were wrong for an %80 accuracy.

Feragatname
Bilgiler ve yayınlar, TradingView tarafından sağlanan veya onaylanan finansal, yatırım, alım satım veya diğer türden tavsiye veya öneriler anlamına gelmez ve teşkil etmez. Kullanım Koşulları bölümünde daha fazlasını okuyun.
Feragatname
Bilgiler ve yayınlar, TradingView tarafından sağlanan veya onaylanan finansal, yatırım, alım satım veya diğer türden tavsiye veya öneriler anlamına gelmez ve teşkil etmez. Kullanım Koşulları bölümünde daha fazlasını okuyun.