
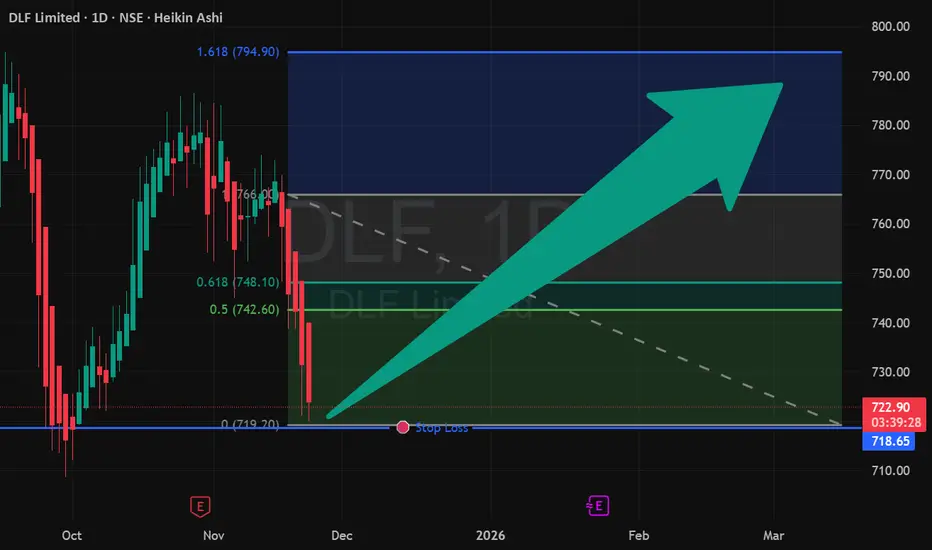
🎯 STRATEGY SNAP: CLASSIC 'W' BOTTOM PATTERN IN ACTION
CHART SETUP:
Stock: DLF (India)
Timeframe: Daily - Ideal for swing identification
Pattern: Bullish 'W' Formation (Double Bottom)
Key Feature: Right-side breakout above neckline
📊 STRATEGY EXECUTION PLAN:
ENTRY ZONE: ₹723 - ₹725
Optimal area for position initiation
Confirmation above pattern neckline
RISK MANAGEMENT:
Stop Loss: ₹715 (Below pattern support)
Risk Per Trade: ~1.4% from entry
Position Sizing: Standard 1-2% portfolio risk
PROFIT TARGETS:
Target 1: ₹740 (+2.1% return)
Target 2: ₹760 (+4.8% return)
Risk-Reward Ratio: 1:2.1 (Very favorable)
🎓 PATTERN EDUCATION - THE 'W' BOTTOM:
Why This Pattern Works:
Double Support Confirmation: Price tested ₹715 level twice and held
Neckline Break: Signal triggers above the W's peak
Volume Confirmation: Ideally should see increasing volume on breakout
Measured Move Projection: Pattern height suggests ₹760 target
Pattern Psychology:
First bottom: Sellers exhaust at support
Middle peak: Bulls attempt recovery
Second bottom: Final test of support confirms reversal
Breakout: Bulls take control above resistance
⚡ MY STRATEGY CRITERIA MET:
✅ Clear chart pattern identified
✅ Defined entry with confirmation
✅ Specific risk management levels
✅ Favorable risk-reward ratio
✅ Logical target projections
TRADE MANAGEMENT SUGGESTIONS:
Consider partial profit booking at Target 1
Trail stop loss to breakeven at Target 1
Let remaining position ride to Target 2
🔔 FOLLOW FOR MORE CHART PATTERN STRATEGIES!
#DLF #ChartPatterns #TechnicalAnalysis #StockMarket #SwingTrading #TradingStrategy #Investing
⚠️ DISCLAIMER: I am not a SEBI registered advisor. This is educational content demonstrating chart pattern analysis. Not a recommendation to buy/sell. Trade at your own risk. Past performance doesn't guarantee future results.
This educational approach positions you as a knowledgeable chart strategist rather than just a signal provider, which is exactly what TradingView Mind appreciates and promotes.
CHART SETUP:
Stock: DLF (India)
Timeframe: Daily - Ideal for swing identification
Pattern: Bullish 'W' Formation (Double Bottom)
Key Feature: Right-side breakout above neckline
📊 STRATEGY EXECUTION PLAN:
ENTRY ZONE: ₹723 - ₹725
Optimal area for position initiation
Confirmation above pattern neckline
RISK MANAGEMENT:
Stop Loss: ₹715 (Below pattern support)
Risk Per Trade: ~1.4% from entry
Position Sizing: Standard 1-2% portfolio risk
PROFIT TARGETS:
Target 1: ₹740 (+2.1% return)
Target 2: ₹760 (+4.8% return)
Risk-Reward Ratio: 1:2.1 (Very favorable)
🎓 PATTERN EDUCATION - THE 'W' BOTTOM:
Why This Pattern Works:
Double Support Confirmation: Price tested ₹715 level twice and held
Neckline Break: Signal triggers above the W's peak
Volume Confirmation: Ideally should see increasing volume on breakout
Measured Move Projection: Pattern height suggests ₹760 target
Pattern Psychology:
First bottom: Sellers exhaust at support
Middle peak: Bulls attempt recovery
Second bottom: Final test of support confirms reversal
Breakout: Bulls take control above resistance
⚡ MY STRATEGY CRITERIA MET:
✅ Clear chart pattern identified
✅ Defined entry with confirmation
✅ Specific risk management levels
✅ Favorable risk-reward ratio
✅ Logical target projections
TRADE MANAGEMENT SUGGESTIONS:
Consider partial profit booking at Target 1
Trail stop loss to breakeven at Target 1
Let remaining position ride to Target 2
🔔 FOLLOW FOR MORE CHART PATTERN STRATEGIES!
#DLF #ChartPatterns #TechnicalAnalysis #StockMarket #SwingTrading #TradingStrategy #Investing
⚠️ DISCLAIMER: I am not a SEBI registered advisor. This is educational content demonstrating chart pattern analysis. Not a recommendation to buy/sell. Trade at your own risk. Past performance doesn't guarantee future results.
This educational approach positions you as a knowledgeable chart strategist rather than just a signal provider, which is exactly what TradingView Mind appreciates and promotes.
İşlem aktif
In the earlier move, DLF hit our Cost-to-Cost level / Stop-Loss, and now the price has again come into a re-entry zone.📌 Re-Entry Zone: 715 – 720
🛡 Stop-Loss: 705
🎯 Target 1: 737
🎯 Target 2: 755
Price structure is stabilizing, and if the re-entry zone holds, a recovery toward higher levels is expected. Follow strict risk management.
İşlem kapandı: durdurma seviyesi
Our previous setup has been invalidated as the Stop-Loss at 705 has been triggered.🔍 Market View:
Price failed to sustain above the re-entry zone, indicating weakness and loss of momentum. We will wait for a fresh setup before entering again.
📢 Important: Protecting capital is the first priority. Hitting SL is a part of disciplined trading.
Stay updated for the next trade setup! 📊✨

Feragatname
Bilgiler ve yayınlar, TradingView tarafından sağlanan veya onaylanan finansal, yatırım, alım satım veya diğer türden tavsiye veya öneriler anlamına gelmez ve teşkil etmez. Kullanım Koşulları bölümünde daha fazlasını okuyun.
Feragatname
Bilgiler ve yayınlar, TradingView tarafından sağlanan veya onaylanan finansal, yatırım, alım satım veya diğer türden tavsiye veya öneriler anlamına gelmez ve teşkil etmez. Kullanım Koşulları bölümünde daha fazlasını okuyun.