
DOGEUSD – H4 Compression Near Support, but Still Below Descending Resistance
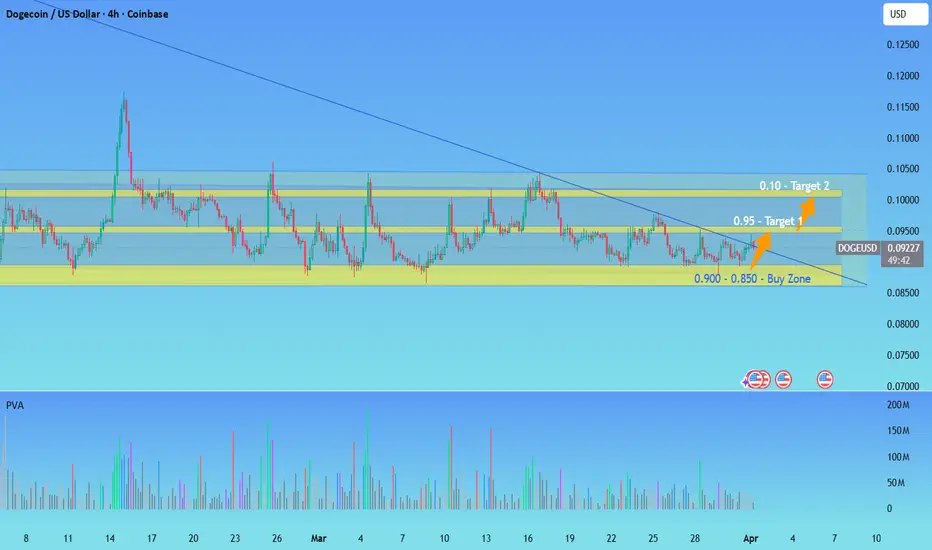
💡DOGE is trading near 0.0919 on the H4 chart and remains trapped inside a broad range while still respecting a descending trendline that continues to cap price from above. The chart shows several reactions from the lower support area, but those rebounds keep failing before turning into a clean breakout of the upper resistance band. In other words, the market is defending support for now, but it still has not shown enough strength to confirm a real bullish expansion.
Structural context
📈The most important feature of this chart is the range itself. Price has been rotating between a lower buy zone around 0.0850–0.0900, an intermediate resistance near 0.0950, and an upper resistance/target zone around 0.1000–0.1020. The blue descending trendline continues to limit price, which means the structure is still in compression, not in impulse.
🔹That matters because DOGE is not in expansion mode at the moment. It is sitting at a decision point. Price is closer to the lower half of the range, near the buy zone, but still below the descending trendline and still below the intermediate resistance. In practical terms, this creates a situation where downside is being defended, but upside is still unproven.
PVSRA reading
📊From a PVSRA perspective, the chart suggests repeated defensive buying near the lows, but still not enough accumulation to force a structural breakout. There are relevant volume spikes on previous drops into the lower area, which may indicate absorption or discount buying, but every recovery remains limited. That suggests the market is willing to defend the discount zone, but still does not have enough strength to regain control of the whole range.
🔹The repeated inability to sustain above 0.0950 reinforces that reading. If smart money were already truly committed to bullish continuation, price would likely show stronger acceptance above the intermediate resistance instead of repeatedly stalling there. So for now, the read looks more consistent with absorption at the lows and range trading, not with confirmed accumulation ready for expansion.
🔹When we say the reading is more consistent with absorption at the lows and range trading, the central point is this: volume appears on the drops into the lower part of the structure, but that volume is still not producing enough upside displacement. In other words, there is buying defense at the base. When price enters the discount zone, enough orders appear to prevent an immediate collapse. But that alone still does not mean dominant accumulation.
🔹If this were truly strong accumulation, the expected behavior would be different: price would react from the base, recover 0.0950 more easily, accept above that level, and begin pressing 0.1000–0.1020 with much more consistency. That is not what the chart is showing so far.
🔹What the chart is showing is a repetitive pattern: drop into the base, volume comes in, moderate rebound, stall in the middle of the range, and then another loss of momentum. That behavior is typical of a market in relative equilibrium inside a range, not a market already entering expansion. In other words, buyers are strong enough to defend the lower boundary, but not strong enough to take control of the whole structure. At the same time, sellers are not able to destroy support completely, but they are still capable of capping price before a cleaner reversal can take place.
Main scenario
📌The main scenario is still sideways behavior inside the range, with only a slight bullish edge as long as the buy zone continues to hold.
🔹As long as DOGE remains above the 0.0850–0.0900 zone, the chart still allows another rotation toward 0.0950 first and then, if momentum improves, toward 0.1000–0.1020. That also matches the arrows marked on the chart toward Target 1 and Target 2.
🔹But that path only becomes more credible if price reclaims the descending trendline and sustains acceptance above 0.0950. Without that, every bounce remains vulnerable to failure and a move back into the range.
Alternative scenario
📌The alternative scenario is a clean loss of the buy zone.
🔹If DOGE loses the 0.0850–0.0900 area with acceptance below, the entire range logic weakens and the chart starts to look less like accumulation and more like a sequence of failed rebounds under descending trendline pressure. In that case, the lower boundary stops acting as a trampoline and the asset begins opening room for a deeper bearish extension.
🔹That is the decisive point: while support holds, the market can still argue for rotation. Once that support fails, the balance shifts much more clearly toward downside continuation.
Invalidation
🔴The bearish reading begins to lose strength if DOGE reclaims 0.0950 with acceptance and then breaks the descending trendline. A stronger invalidation of the current neutral-fragile structure would come from sustained price above the upper resistance band between 0.1000 and 0.1020.
🔹That would be the first more convincing signal that the market has stopped merely reacting from the lower boundary and has actually started transitioning from compression into expansion.
Cycle-buy possibility
🟢Another possibility is to treat the 0.090–0.085 area as a cycle buy zone, not just as a range-trade region. In that case, the logic changes completely: it stops being a trade focused only on rotation inside the range and becomes a bet on the asset’s structural survival for a future expansion cycle. On the weekly chart, this region appears as a long-term accumulation zone, while the 0.15, 0.20, 0.30, and 0.50 levels act as potential cycle targets if the market can break out of the current compression and rebuild trend. The key is to keep the reading realistic: those levels exist as cycle projections, not as an automatic extension of the current move. As long as DOGE remains trapped below 0.0950 and, more importantly, below 0.1000–0.1020 on H4, what exists is support defense, not confirmed reversal. The 0.050 area, near the historical bottom, remains the main structural risk reference if the market loses the current base and enters a deeper capitulation scenario.

⚡So the plan needs to stay simple:
defend 0.0850–0.0900,
try to reclaim 0.0950,
and only then assess whether there is real strength to attack 0.1000–0.1020 instead of automatically assuming the cycle has already turned.
⚡Another possibility is to remove the stop and let the position run toward the cycle thesis. But that completely changes the nature of the trade. In that case, it stops being a classic technical swing and becomes a cycle bet. That approach only makes sense for someone willing to use smaller size, stronger conviction, and real tolerance for large drawdowns before any more consistent recovery appears.
Final reading
💡At this moment, DOGE does not look like a clean breakout chart. It looks like a compressed H4 range sitting near support, with repeated defense at the lows, but still capped by resistance and by the descending trendline. That means the market is not weak enough to collapse immediately, but it is also still not strong enough to confirm a real bullish move.
🔹So the most coherent reading is this: the 0.0850–0.0900 area remains the key support, 0.0950 is the first important reclaim level, and 0.1000–0.1020 remains the real test for the bullish side. Until price proves acceptance above those higher regions, DOGE remains in a range structure, not in a confirmed expansion phase.
Important warning
⚠️Altcoins tend to suffer very wide swings, and technical stops can be taken out easily by geopolitical headlines, macro volatility, or temporary liquidity hunts, even before the main move resumes. That approach only makes sense with smaller size, stronger conviction, and real tolerance for deep drawdowns.
⚠️In addition, there is strong dependence on Bitcoin and on geopolitical headlines, which makes this setup more speculative than a clean directional read. DOGE has a history of explosive narrative-driven moves, including themes related to Elon Musk, X payments integration, and similar catalysts. Any concrete positive news about de-escalation in Iran, or even an Elon tweet, could trigger a fast short squeeze. The risk of volatility and whipsaw here is elevated.
⚠️This content is for educational and informational purposes only. It is not financial advice. Always manage your risk with discipline.
If this analysis added value:
👍like the post
💬comment your bias
⭐and follow the profile for more studies on liquidity, structure, and price action.
FX Liquidity Lab
Understand liquidity. Anticipate the move.
💡DOGE is trading near 0.0919 on the H4 chart and remains trapped inside a broad range while still respecting a descending trendline that continues to cap price from above. The chart shows several reactions from the lower support area, but those rebounds keep failing before turning into a clean breakout of the upper resistance band. In other words, the market is defending support for now, but it still has not shown enough strength to confirm a real bullish expansion.
Structural context
📈The most important feature of this chart is the range itself. Price has been rotating between a lower buy zone around 0.0850–0.0900, an intermediate resistance near 0.0950, and an upper resistance/target zone around 0.1000–0.1020. The blue descending trendline continues to limit price, which means the structure is still in compression, not in impulse.
🔹That matters because DOGE is not in expansion mode at the moment. It is sitting at a decision point. Price is closer to the lower half of the range, near the buy zone, but still below the descending trendline and still below the intermediate resistance. In practical terms, this creates a situation where downside is being defended, but upside is still unproven.
PVSRA reading
📊From a PVSRA perspective, the chart suggests repeated defensive buying near the lows, but still not enough accumulation to force a structural breakout. There are relevant volume spikes on previous drops into the lower area, which may indicate absorption or discount buying, but every recovery remains limited. That suggests the market is willing to defend the discount zone, but still does not have enough strength to regain control of the whole range.
🔹The repeated inability to sustain above 0.0950 reinforces that reading. If smart money were already truly committed to bullish continuation, price would likely show stronger acceptance above the intermediate resistance instead of repeatedly stalling there. So for now, the read looks more consistent with absorption at the lows and range trading, not with confirmed accumulation ready for expansion.
🔹When we say the reading is more consistent with absorption at the lows and range trading, the central point is this: volume appears on the drops into the lower part of the structure, but that volume is still not producing enough upside displacement. In other words, there is buying defense at the base. When price enters the discount zone, enough orders appear to prevent an immediate collapse. But that alone still does not mean dominant accumulation.
🔹If this were truly strong accumulation, the expected behavior would be different: price would react from the base, recover 0.0950 more easily, accept above that level, and begin pressing 0.1000–0.1020 with much more consistency. That is not what the chart is showing so far.
🔹What the chart is showing is a repetitive pattern: drop into the base, volume comes in, moderate rebound, stall in the middle of the range, and then another loss of momentum. That behavior is typical of a market in relative equilibrium inside a range, not a market already entering expansion. In other words, buyers are strong enough to defend the lower boundary, but not strong enough to take control of the whole structure. At the same time, sellers are not able to destroy support completely, but they are still capable of capping price before a cleaner reversal can take place.
Main scenario
📌The main scenario is still sideways behavior inside the range, with only a slight bullish edge as long as the buy zone continues to hold.
🔹As long as DOGE remains above the 0.0850–0.0900 zone, the chart still allows another rotation toward 0.0950 first and then, if momentum improves, toward 0.1000–0.1020. That also matches the arrows marked on the chart toward Target 1 and Target 2.
🔹But that path only becomes more credible if price reclaims the descending trendline and sustains acceptance above 0.0950. Without that, every bounce remains vulnerable to failure and a move back into the range.
Alternative scenario
📌The alternative scenario is a clean loss of the buy zone.
🔹If DOGE loses the 0.0850–0.0900 area with acceptance below, the entire range logic weakens and the chart starts to look less like accumulation and more like a sequence of failed rebounds under descending trendline pressure. In that case, the lower boundary stops acting as a trampoline and the asset begins opening room for a deeper bearish extension.
🔹That is the decisive point: while support holds, the market can still argue for rotation. Once that support fails, the balance shifts much more clearly toward downside continuation.
Invalidation
🔴The bearish reading begins to lose strength if DOGE reclaims 0.0950 with acceptance and then breaks the descending trendline. A stronger invalidation of the current neutral-fragile structure would come from sustained price above the upper resistance band between 0.1000 and 0.1020.
🔹That would be the first more convincing signal that the market has stopped merely reacting from the lower boundary and has actually started transitioning from compression into expansion.
Cycle-buy possibility
🟢Another possibility is to treat the 0.090–0.085 area as a cycle buy zone, not just as a range-trade region. In that case, the logic changes completely: it stops being a trade focused only on rotation inside the range and becomes a bet on the asset’s structural survival for a future expansion cycle. On the weekly chart, this region appears as a long-term accumulation zone, while the 0.15, 0.20, 0.30, and 0.50 levels act as potential cycle targets if the market can break out of the current compression and rebuild trend. The key is to keep the reading realistic: those levels exist as cycle projections, not as an automatic extension of the current move. As long as DOGE remains trapped below 0.0950 and, more importantly, below 0.1000–0.1020 on H4, what exists is support defense, not confirmed reversal. The 0.050 area, near the historical bottom, remains the main structural risk reference if the market loses the current base and enters a deeper capitulation scenario.
⚡So the plan needs to stay simple:
defend 0.0850–0.0900,
try to reclaim 0.0950,
and only then assess whether there is real strength to attack 0.1000–0.1020 instead of automatically assuming the cycle has already turned.
⚡Another possibility is to remove the stop and let the position run toward the cycle thesis. But that completely changes the nature of the trade. In that case, it stops being a classic technical swing and becomes a cycle bet. That approach only makes sense for someone willing to use smaller size, stronger conviction, and real tolerance for large drawdowns before any more consistent recovery appears.
Final reading
💡At this moment, DOGE does not look like a clean breakout chart. It looks like a compressed H4 range sitting near support, with repeated defense at the lows, but still capped by resistance and by the descending trendline. That means the market is not weak enough to collapse immediately, but it is also still not strong enough to confirm a real bullish move.
🔹So the most coherent reading is this: the 0.0850–0.0900 area remains the key support, 0.0950 is the first important reclaim level, and 0.1000–0.1020 remains the real test for the bullish side. Until price proves acceptance above those higher regions, DOGE remains in a range structure, not in a confirmed expansion phase.
Important warning
⚠️Altcoins tend to suffer very wide swings, and technical stops can be taken out easily by geopolitical headlines, macro volatility, or temporary liquidity hunts, even before the main move resumes. That approach only makes sense with smaller size, stronger conviction, and real tolerance for deep drawdowns.
⚠️In addition, there is strong dependence on Bitcoin and on geopolitical headlines, which makes this setup more speculative than a clean directional read. DOGE has a history of explosive narrative-driven moves, including themes related to Elon Musk, X payments integration, and similar catalysts. Any concrete positive news about de-escalation in Iran, or even an Elon tweet, could trigger a fast short squeeze. The risk of volatility and whipsaw here is elevated.
⚠️This content is for educational and informational purposes only. It is not financial advice. Always manage your risk with discipline.
If this analysis added value:
👍like the post
💬comment your bias
⭐and follow the profile for more studies on liquidity, structure, and price action.
FX Liquidity Lab
Understand liquidity. Anticipate the move.
İşlem aktif
DOGE reached Target 1 at 0.095, which validates the read of base defense and rotation inside the structure.Even so, I am keeping the trade open, because I still believe in the expansion of the Bitcoin cycle and in the possibility that DOGE can move toward higher levels if crypto flows continue to improve.
In addition, I am also accumulating the position on each new retest of support, treating this zone as a buy area within the broader cycle thesis.
From here, the logic is no longer just about the first technical target. It becomes a cycle-management approach. As long as price continues to hold structure and BTC stays strong, I am giving the trade room to continue.
Not
TP1 hit, TP2 hit
Feragatname
Bilgiler ve yayınlar, TradingView tarafından sağlanan veya onaylanan finansal, yatırım, alım satım veya diğer türden tavsiye veya öneriler anlamına gelmez ve teşkil etmez. Kullanım Koşulları bölümünde daha fazlasını okuyun.
Feragatname
Bilgiler ve yayınlar, TradingView tarafından sağlanan veya onaylanan finansal, yatırım, alım satım veya diğer türden tavsiye veya öneriler anlamına gelmez ve teşkil etmez. Kullanım Koşulları bölümünde daha fazlasını okuyun.