
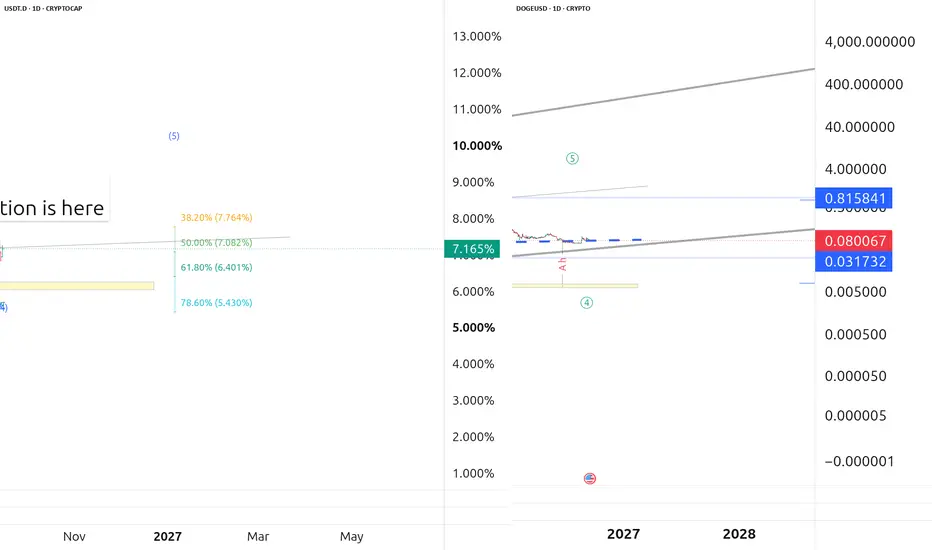
On June 19, I made a prediction on X, and now we all can see how accurate and safe it is.
No matter which cryptocurrency you’re trading, if USDT’s dominance remains above 7.2% for 8+ hours, it will confirm that the downtrend is continuing. A failure to hold above that level will signal a final bullish rally before the bear market resumes. If the bullish rally is the case, I would take profits on Dogecoin at the 0.143, 0.163, and 0.23 levels. Hovever, my base case is 0.0324 and probably 0.0094.

As you may know, bonds is a key driver for many collateral markets, thus it has a negative correlation. It is called Cross-market analysis, one of the safest approaches in trading systems. My base case is the one you see on the 10-year yields screenshot, i.e. - a simple one, regular.
However, I see two more possible scenarios for the price structure of U.S. Treasuries may take:
1) An Ending Diagonal - the swings within this structure will likely be accompanied by a strengthening of the Japanese yen, a slow increase in raw commodity prices and metals, also a possible rise in cryptocurrency prices - in the near term. I.e, if this would be the case - bonds will pull back from the current values to the lower trend-line of the triangle: ~4.185%.
2) What really matters is the alternative waves count interpretation: the pattern above may turn out to be a Zigzag, rather than an impulse. In that case, the target will reach above 7.66%. This case means an aggressive downward for all the collateral markets.
There is a video on youtube. In the second part, I describe how I identified 2 probable bearish targets for Dogecoin price. I've been pointing to these targets since 2022 how I found them. I think achieving these goals will largely depend on the shape that U.S. Treasury bonds will take.
No matter which cryptocurrency you’re trading, if USDT’s dominance remains above 7.2% for 8+ hours, it will confirm that the downtrend is continuing. A failure to hold above that level will signal a final bullish rally before the bear market resumes. If the bullish rally is the case, I would take profits on Dogecoin at the 0.143, 0.163, and 0.23 levels. Hovever, my base case is 0.0324 and probably 0.0094.
As you may know, bonds is a key driver for many collateral markets, thus it has a negative correlation. It is called Cross-market analysis, one of the safest approaches in trading systems. My base case is the one you see on the 10-year yields screenshot, i.e. - a simple one, regular.
However, I see two more possible scenarios for the price structure of U.S. Treasuries may take:
1) An Ending Diagonal - the swings within this structure will likely be accompanied by a strengthening of the Japanese yen, a slow increase in raw commodity prices and metals, also a possible rise in cryptocurrency prices - in the near term. I.e, if this would be the case - bonds will pull back from the current values to the lower trend-line of the triangle: ~4.185%.
2) What really matters is the alternative waves count interpretation: the pattern above may turn out to be a Zigzag, rather than an impulse. In that case, the target will reach above 7.66%. This case means an aggressive downward for all the collateral markets.
There is a video on youtube. In the second part, I describe how I identified 2 probable bearish targets for Dogecoin price. I've been pointing to these targets since 2022 how I found them. I think achieving these goals will largely depend on the shape that U.S. Treasury bonds will take.

Feragatname
Bilgiler ve yayınlar, TradingView tarafından sağlanan veya onaylanan finansal, yatırım, alım satım veya diğer türden tavsiye veya öneriler anlamına gelmez ve teşkil etmez. Kullanım Koşulları bölümünde daha fazlasını okuyun.
Feragatname
Bilgiler ve yayınlar, TradingView tarafından sağlanan veya onaylanan finansal, yatırım, alım satım veya diğer türden tavsiye veya öneriler anlamına gelmez ve teşkil etmez. Kullanım Koşulları bölümünde daha fazlasını okuyun.