
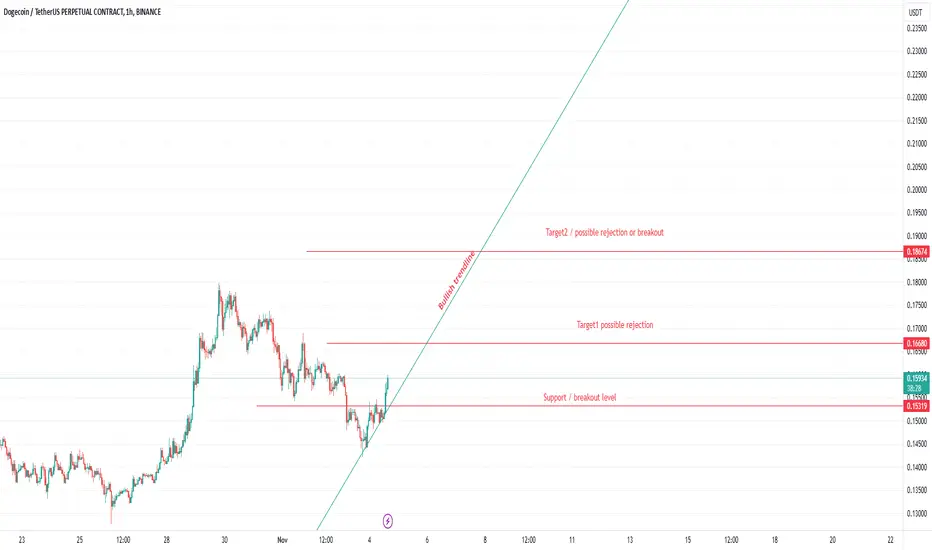
Doge long chart.
The diagonal line is the bullish trend. Each one of the two targets can reject the price to lower values.
When the diagonal line is broken the bullish trend is broken and most of the times the price will go down.
The diagonal line is the bullish trend. Each one of the two targets can reject the price to lower values.
When the diagonal line is broken the bullish trend is broken and most of the times the price will go down.

Feragatname
Bilgiler ve yayınlar, TradingView tarafından sağlanan veya onaylanan finansal, yatırım, alım satım veya diğer türden tavsiye veya öneriler anlamına gelmez ve teşkil etmez. Kullanım Koşulları bölümünde daha fazlasını okuyun.
Feragatname
Bilgiler ve yayınlar, TradingView tarafından sağlanan veya onaylanan finansal, yatırım, alım satım veya diğer türden tavsiye veya öneriler anlamına gelmez ve teşkil etmez. Kullanım Koşulları bölümünde daha fazlasını okuyun.