
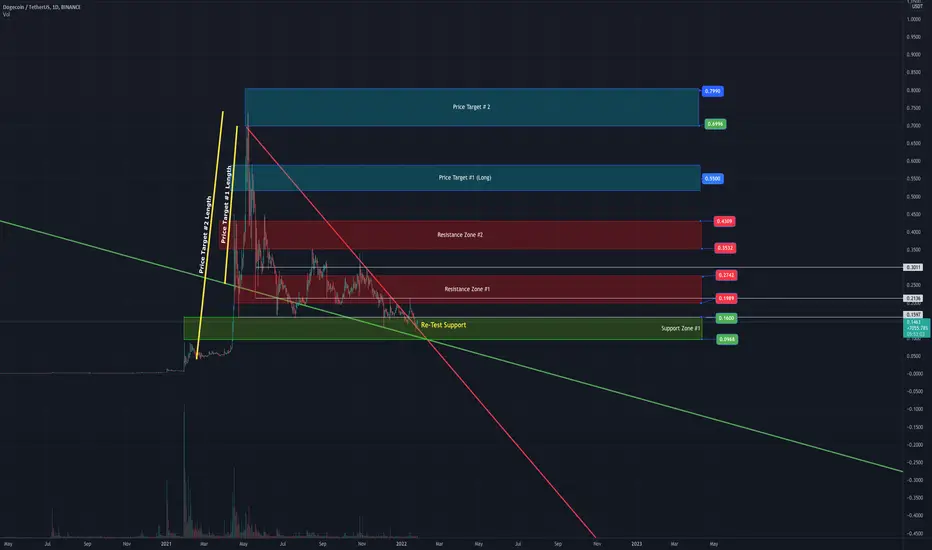
Daily Chart
Descending Triangle Pattern:
-First Breakout was on Jan 10th
-Retest of support line was successful ->
(Jan 22nd- Jan 25th)
Multiple levels of resistance must be broken,
First Major Area of Resistance:
- Between $0.198 and $0.275
Next Major Area of Resistance:
- Between $0.35 and $0.43
Strong Support Area (as of Jan 26):
- Between $0.095 and $0.16
Price Target #1: around $0.55
Price Target #2: Between $0.69 and $0.80
Previous All Time High: $0.74

Feragatname
Bilgiler ve yayınlar, TradingView tarafından sağlanan veya onaylanan finansal, yatırım, alım satım veya diğer türden tavsiye veya öneriler anlamına gelmez ve teşkil etmez. Kullanım Koşulları bölümünde daha fazlasını okuyun.
Feragatname
Bilgiler ve yayınlar, TradingView tarafından sağlanan veya onaylanan finansal, yatırım, alım satım veya diğer türden tavsiye veya öneriler anlamına gelmez ve teşkil etmez. Kullanım Koşulları bölümünde daha fazlasını okuyun.