
Hello?
Welcome, traders.
By "following", you can always get new information quickly.
Please also click "Like".
Have a good day.
-------------------------------------
(DOTUSDT 1W Chart)

The key is whether you can climb to the 11.72-14.93 section.
To do that, we need to see if it can rise above 7.16.
(1D chart)
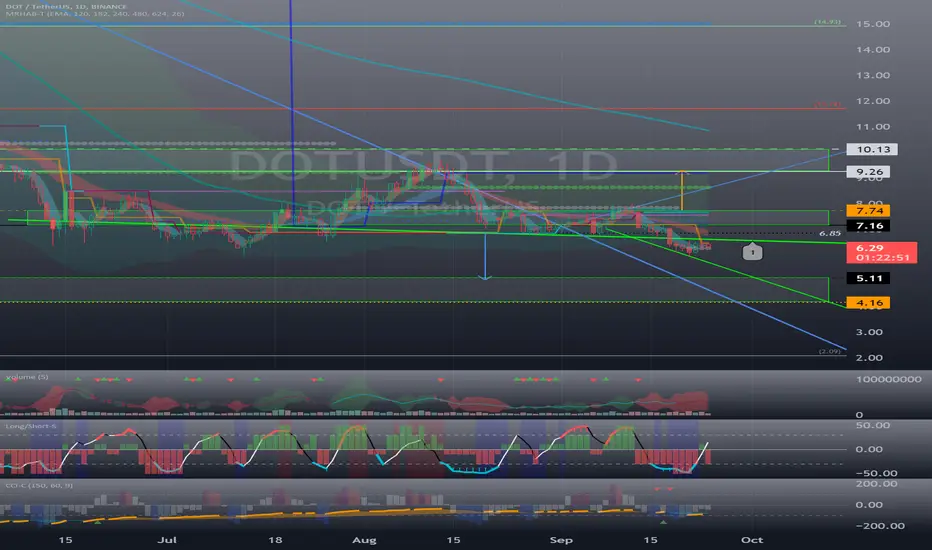
If it fails to rise above the downtrend line (1), it is expected to decline towards the 4.16-5.11 section.
The 11.72-14.93 section is a trend-determining section and is a strong support and resistance section.
Therefore, as we get closer to the 11.72-14.93 range, psychologically, if we don't buy now, we will continue to feel like we are about to surge.
Therefore, you should buy after confirming that it is supported by rising to the 11.72-14.93 section.
Otherwise, you will most likely make the mistake of buying at the high.
The final section where you can buy is possible when you see support in the 7.16-7.74 section.
If you buy in this range, in the short term, you can take profit when you find resistance in the 9.26-10.13 range.
------------------------------------------------------------ -------------------------------------------
** All descriptions are for reference only and do not guarantee a profit or loss in investment.
** If you share this chart, you can use the indicators normally.
** The MRHAB-T indicator contains indicators that indicate support and resistance points.
** Background color of Long/Short-S indicator: RSI oversold and overbought sections
** Background color of CCI-C indicator: When the short-term CCI line is below -100 and above +100, oversold and overbought sections are displayed.
** The OBV indicator was re-created by applying a formula to the DepthHouse Trading indicator, an indicator disclosed by oh92. (Thanks for this.)
(Short-term Stop Loss can be said to be a point where profit and loss can be preserved or additional entry can be made through split trading. It is a short-term investment perspective.)
---------------------------------
Welcome, traders.
By "following", you can always get new information quickly.
Please also click "Like".
Have a good day.
-------------------------------------
(DOTUSDT 1W Chart)
The key is whether you can climb to the 11.72-14.93 section.
To do that, we need to see if it can rise above 7.16.
(1D chart)
If it fails to rise above the downtrend line (1), it is expected to decline towards the 4.16-5.11 section.
The 11.72-14.93 section is a trend-determining section and is a strong support and resistance section.
Therefore, as we get closer to the 11.72-14.93 range, psychologically, if we don't buy now, we will continue to feel like we are about to surge.
Therefore, you should buy after confirming that it is supported by rising to the 11.72-14.93 section.
Otherwise, you will most likely make the mistake of buying at the high.
The final section where you can buy is possible when you see support in the 7.16-7.74 section.
If you buy in this range, in the short term, you can take profit when you find resistance in the 9.26-10.13 range.
------------------------------------------------------------ -------------------------------------------
** All descriptions are for reference only and do not guarantee a profit or loss in investment.
** If you share this chart, you can use the indicators normally.
** The MRHAB-T indicator contains indicators that indicate support and resistance points.
** Background color of Long/Short-S indicator: RSI oversold and overbought sections
** Background color of CCI-C indicator: When the short-term CCI line is below -100 and above +100, oversold and overbought sections are displayed.
** The OBV indicator was re-created by applying a formula to the DepthHouse Trading indicator, an indicator disclosed by oh92. (Thanks for this.)
(Short-term Stop Loss can be said to be a point where profit and loss can be preserved or additional entry can be made through split trading. It is a short-term investment perspective.)
---------------------------------

YouTube: youtube.com/@readcrypto9837
※ Follow X to check out the posts.
※ X를 팔로우하고 게시물을 확인하세요.
◆ t.me/readCryptoChannel
[HA-MS Indicator]
bit.ly/3YxHgvN
[OBV Indicator]
bit.ly/4dcyny3
※ Follow X to check out the posts.
※ X를 팔로우하고 게시물을 확인하세요.
◆ t.me/readCryptoChannel
[HA-MS Indicator]
bit.ly/3YxHgvN
[OBV Indicator]
bit.ly/4dcyny3
İlgili yayınlar
Feragatname
Bilgiler ve yayınlar, TradingView tarafından sağlanan veya onaylanan finansal, yatırım, alım satım veya diğer türden tavsiye veya öneriler anlamına gelmez ve teşkil etmez. Kullanım Koşulları bölümünde daha fazlasını okuyun.
YouTube: youtube.com/@readcrypto9837
※ Follow X to check out the posts.
※ X를 팔로우하고 게시물을 확인하세요.
◆ t.me/readCryptoChannel
[HA-MS Indicator]
bit.ly/3YxHgvN
[OBV Indicator]
bit.ly/4dcyny3
※ Follow X to check out the posts.
※ X를 팔로우하고 게시물을 확인하세요.
◆ t.me/readCryptoChannel
[HA-MS Indicator]
bit.ly/3YxHgvN
[OBV Indicator]
bit.ly/4dcyny3
İlgili yayınlar
Feragatname
Bilgiler ve yayınlar, TradingView tarafından sağlanan veya onaylanan finansal, yatırım, alım satım veya diğer türden tavsiye veya öneriler anlamına gelmez ve teşkil etmez. Kullanım Koşulları bölümünde daha fazlasını okuyun.