
Dr reddys lab.
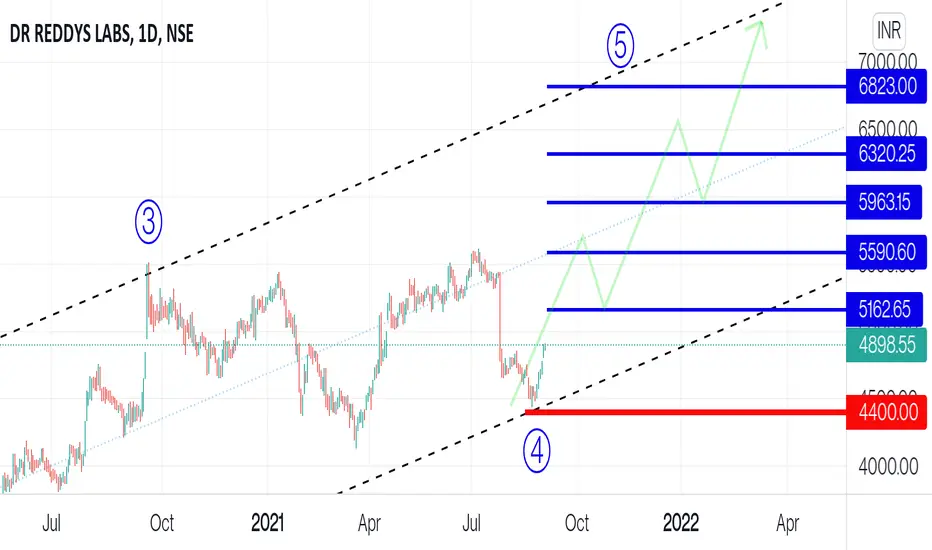
The stock has completed running flat pattern in wave 4 at the weekly lower bollinger band, also weekly oscillator stochastic has completed its pullback cycle at oversold zones and now it has done positive crossover. the wave structure is suggesting the start of the larger degree wave 5, as wave 5 unfolds, the price can attempt to go higher towards 6800, 7000 & more, also there is a possibility of price rising higher more than 7500 if the up move extends towards the upper end of the rising channel. one can invest or go long at current level or in dips (if any) with stoploss of 4400, the weekly swing low of 4446 will now be a major support level to watch out for in the forthcoming weeks.
Weekly Cycle wave structure

Key Levels are Mentioned on chart

Completed running flat pattern in wave 4.

Weekly stochastic has done positive crossover at oversold zones and now its uptick

Price tooked support from long term horizontal trendline

Morning star at weekly lower bollinger band

Macd in daily positive crossover and Uptick

Rsi in daily Uptick and near 60

Daily Bollinger

Dmi adx also positive crossover

Disclaimer
I am not sebi registered analyst
My studies are Educational purpose only
Consult with your Financial advisor before trading or investing
The stock has completed running flat pattern in wave 4 at the weekly lower bollinger band, also weekly oscillator stochastic has completed its pullback cycle at oversold zones and now it has done positive crossover. the wave structure is suggesting the start of the larger degree wave 5, as wave 5 unfolds, the price can attempt to go higher towards 6800, 7000 & more, also there is a possibility of price rising higher more than 7500 if the up move extends towards the upper end of the rising channel. one can invest or go long at current level or in dips (if any) with stoploss of 4400, the weekly swing low of 4446 will now be a major support level to watch out for in the forthcoming weeks.
Weekly Cycle wave structure
Key Levels are Mentioned on chart
Completed running flat pattern in wave 4.
Weekly stochastic has done positive crossover at oversold zones and now its uptick
Price tooked support from long term horizontal trendline
Morning star at weekly lower bollinger band
Macd in daily positive crossover and Uptick
Rsi in daily Uptick and near 60
Daily Bollinger
Dmi adx also positive crossover
Disclaimer
I am not sebi registered analyst
My studies are Educational purpose only
Consult with your Financial advisor before trading or investing
Not

YouTube: youtube.com/@rk_charts
Telegram : t.me/RK_Charts
Twitter : @charts_rk
Email : rkcharts@gmail. com
Disclaimer.
I am not sebi registered analyst.
My studies are for educational purpose only.
Telegram : t.me/RK_Charts
Twitter : @charts_rk
Email : rkcharts@gmail. com
Disclaimer.
I am not sebi registered analyst.
My studies are for educational purpose only.
İlgili yayınlar
Feragatname
Bilgiler ve yayınlar, TradingView tarafından sağlanan veya onaylanan finansal, yatırım, alım satım veya diğer türden tavsiye veya öneriler anlamına gelmez ve teşkil etmez. Kullanım Koşulları bölümünde daha fazlasını okuyun.
YouTube: youtube.com/@rk_charts
Telegram : t.me/RK_Charts
Twitter : @charts_rk
Email : rkcharts@gmail. com
Disclaimer.
I am not sebi registered analyst.
My studies are for educational purpose only.
Telegram : t.me/RK_Charts
Twitter : @charts_rk
Email : rkcharts@gmail. com
Disclaimer.
I am not sebi registered analyst.
My studies are for educational purpose only.
İlgili yayınlar
Feragatname
Bilgiler ve yayınlar, TradingView tarafından sağlanan veya onaylanan finansal, yatırım, alım satım veya diğer türden tavsiye veya öneriler anlamına gelmez ve teşkil etmez. Kullanım Koşulları bölümünde daha fazlasını okuyun.