
Currently at an area where price congested and broke higher to start a 23-month bull run in 2018-19.
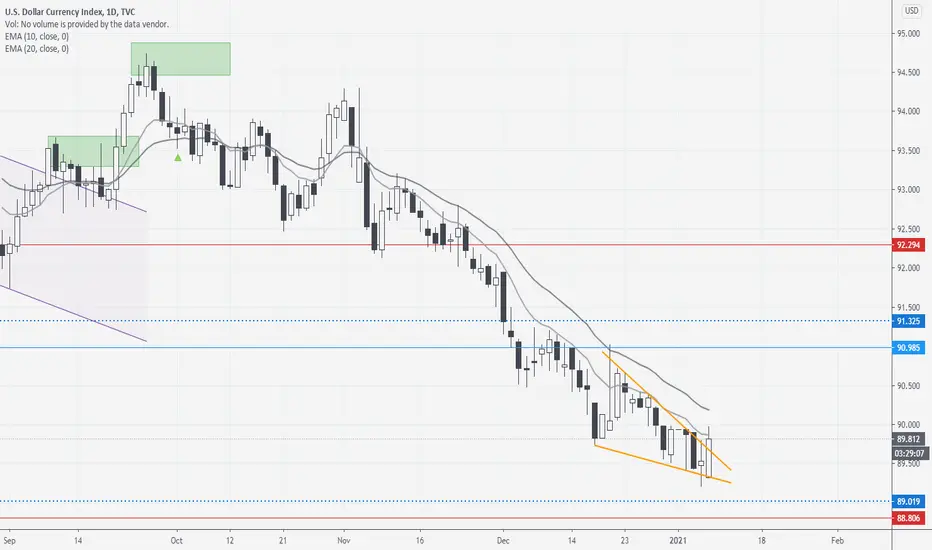
LTF is showing a possible bottom with the formation of a higher high and a breakout from this descending wedge pattern.
Likely to see some kind of trading range before any decisive bullish breakout/reversal but today's candle is pretty bullish and the bulls would be looking to close the day strong. Context is okay for reversal here so we shall see.
A bearish break below 89 invalidates this view.
Weekly chart:

LTF is showing a possible bottom with the formation of a higher high and a breakout from this descending wedge pattern.
Likely to see some kind of trading range before any decisive bullish breakout/reversal but today's candle is pretty bullish and the bulls would be looking to close the day strong. Context is okay for reversal here so we shall see.
A bearish break below 89 invalidates this view.
Weekly chart:

Feragatname
Bilgiler ve yayınlar, TradingView tarafından sağlanan veya onaylanan finansal, yatırım, alım satım veya diğer türden tavsiye veya öneriler anlamına gelmez ve teşkil etmez. Kullanım Koşulları bölümünde daha fazlasını okuyun.
Feragatname
Bilgiler ve yayınlar, TradingView tarafından sağlanan veya onaylanan finansal, yatırım, alım satım veya diğer türden tavsiye veya öneriler anlamına gelmez ve teşkil etmez. Kullanım Koşulları bölümünde daha fazlasını okuyun.