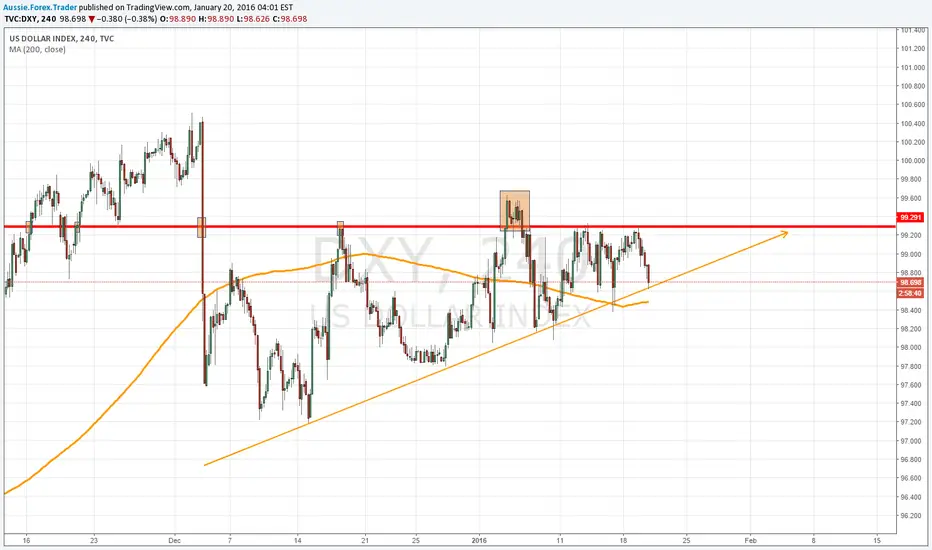
This is more of a thought, than a trading idea...
There is a rising wedge, of which is about to complete, on DXY.
DXY.
This is a bearish pattern, and if I'm correct, its full formation may coincide with the latest USD data that is due to be released on Thursday.
There is a rising wedge, of which is about to complete, on
DXY. This is a bearish pattern, and if I'm correct, its full formation may coincide with the latest USD data that is due to be released on Thursday.
Not
This wasn't the best example or a rising wedge, it's more like a rising triangle (yes, I see price on 05/01/16 broke 99.27). However, what this chart does tell us is that something huge is about to happen. USD will either smash its way up, or resume its downtrend.
Feragatname
Bilgiler ve yayınlar, TradingView tarafından sağlanan veya onaylanan finansal, yatırım, alım satım veya diğer türden tavsiye veya öneriler anlamına gelmez ve teşkil etmez. Kullanım Koşulları bölümünde daha fazlasını okuyun.
Feragatname
Bilgiler ve yayınlar, TradingView tarafından sağlanan veya onaylanan finansal, yatırım, alım satım veya diğer türden tavsiye veya öneriler anlamına gelmez ve teşkil etmez. Kullanım Koşulları bölümünde daha fazlasını okuyun.