
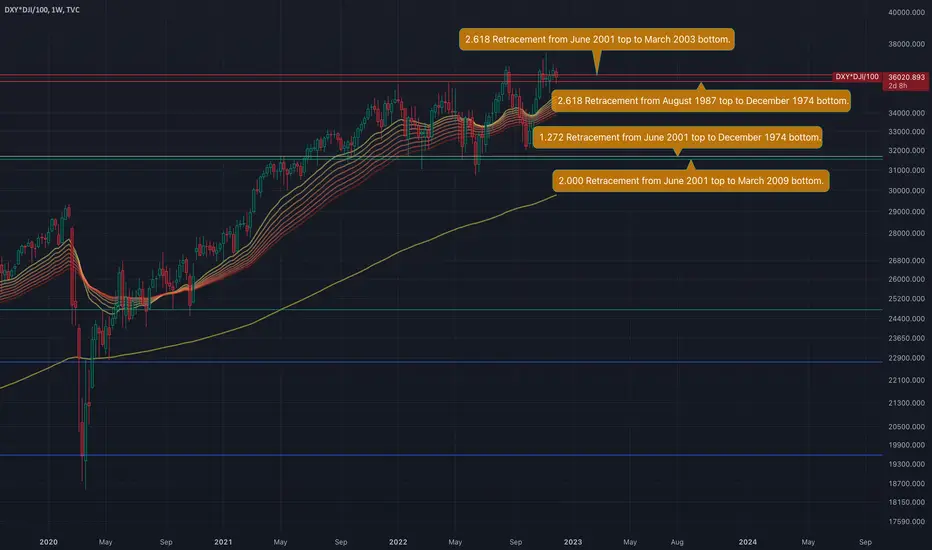
Trapped between these very important retracements. They act as price magnets, and significant support/resistance levels.
These were drawn with the magnet tool, so there is no bias towards their positions.
Do note that we are analyzing the DXY*DJI chart, which shows us a clearer picture of recent price action.
A closeup.

Are we in UTAD?
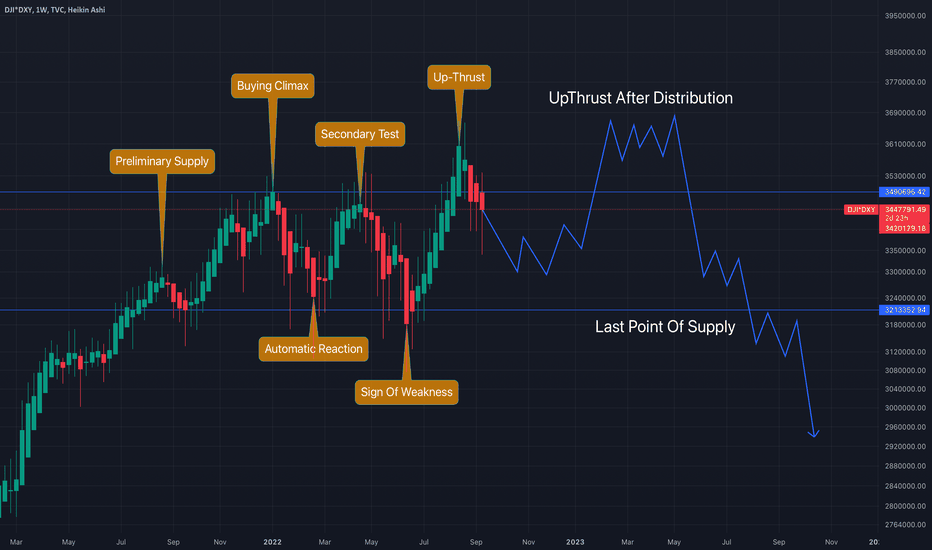
And another beauty...

Tread lightly, for this is hallowed ground.
-Father Grigori
These were drawn with the magnet tool, so there is no bias towards their positions.
Do note that we are analyzing the DXY*DJI chart, which shows us a clearer picture of recent price action.
A closeup.
Are we in UTAD?
And another beauty...
Tread lightly, for this is hallowed ground.
-Father Grigori
Not
The violation of this trend marks the end of QE. This shows the true effect. I hope you all understand it.With Green and Red arrows, I have marked the points I used to draw the rays.
These long-term rays, prove as significant resistance.
Hitting one of them, was a fundamental reason the Black Monday was so severe.

İlgili yayınlar
Feragatname
Bilgiler ve yayınlar, TradingView tarafından sağlanan veya onaylanan finansal, yatırım, alım satım veya diğer türden tavsiye veya öneriler anlamına gelmez ve teşkil etmez. Kullanım Koşulları bölümünde daha fazlasını okuyun.
İlgili yayınlar
Feragatname
Bilgiler ve yayınlar, TradingView tarafından sağlanan veya onaylanan finansal, yatırım, alım satım veya diğer türden tavsiye veya öneriler anlamına gelmez ve teşkil etmez. Kullanım Koşulları bölümünde daha fazlasını okuyun.