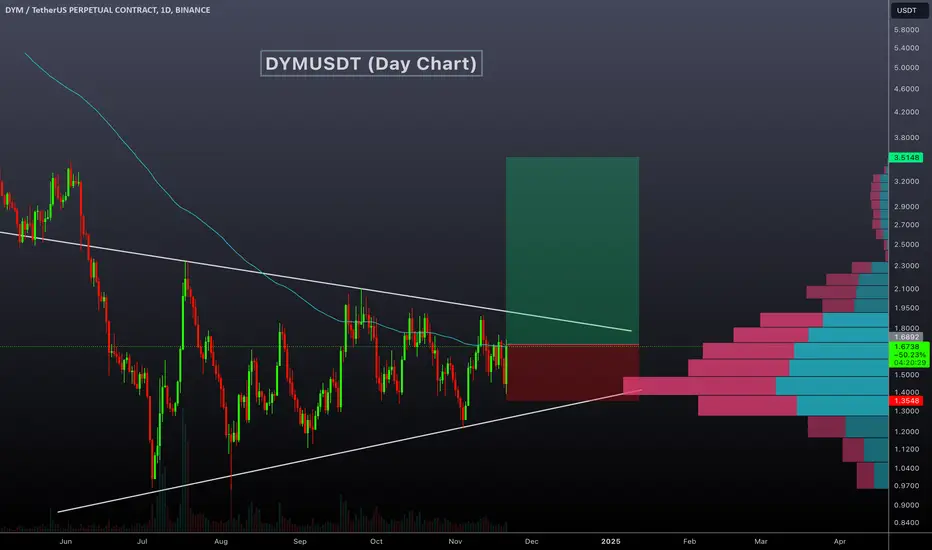
DYMUSDT Technical analysis update
DYMUSDT has been trading within a triangle formation for the past 165 days. The price is now moving towards the triangle's resistance level, potentially signaling a breakout. The profile volume indicates strong support at $1.40, and the price has crossed above the 100 EMA on the daily chart. A strong bullish move can be expected from the current level.
Buy zone : Below $1.70
Stop loss : $1.37
Take Profit 1: $1.97
Take Profit 2: $2.47
Take Profit 3: $3.45
İşlem aktif

 DYMUSDT TP 1 hit
20%+ profit

🚀Telegram : t.me/hexatrades
🌐Website: hexatrades.io/
🗣️Twitter(X): twitter.com/HexaTrades
🌐Website: hexatrades.io/
🗣️Twitter(X): twitter.com/HexaTrades
İlgili yayınlar
Feragatname
Bilgiler ve yayınlar, TradingView tarafından sağlanan veya onaylanan finansal, yatırım, alım satım veya diğer türden tavsiye veya öneriler anlamına gelmez ve teşkil etmez. Kullanım Koşulları bölümünde daha fazlasını okuyun.