
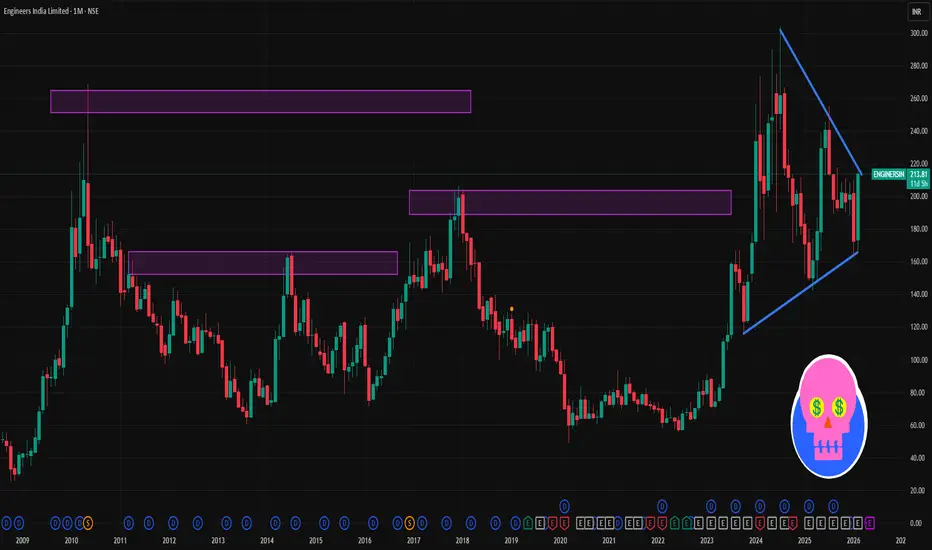
🟡 Current Price Context (as of mid-Feb 2026)
The stock has recently traded around ₹200–₹215 on NSE — a volatile move higher in the past few sessions.
📊 1-Month Support & Resistance Levels
(These are weekly-to-monthly pivot & technical levels to watch if you’re looking at a 1-month timeframe.)
🔼 Resistance Zones
~₹208 – ₹214: Near current short-term highs / recent pivot ~R1 zone.
₹215 – ₹221: Upper resistance cluster where price may see supply / reversal pressure.
~₹225 – ₹230+: Secondary resistance if trend accelerates.
🔽 Support Zones
~₹195 – ₹200: Immediate support / prior pivot area.
₹187 – ₹190: Mid-range support from recent moving averages & pivot structures.
₹180 – ₹185: Lower support zone, often seen as demand area in a pullback.
📉 Technical Indicators (Short-Term Bias)
Moving averages (like 20/50/100 DMA) often act as dynamic support/resistance — current data suggests 50-day/200-day near ₹180-₹190 (neutral to positive).
Momentum indicators like RSI can help confirm strength — if above 60 + rising, short-term bullish; if falling below ~50, risk of deeper pullback.
📌 Quick Summary (1-Month Frame)
Bullish breakout if price sustains above ~₹215-₹221 — could target higher resistance ~₹225-₹230.
Neutral / sideways near current levels (~₹200-₹208) — price may trade in that band.
Strong support ~₹180-₹195 — breakdown below this can signal deeper correction.
The stock has recently traded around ₹200–₹215 on NSE — a volatile move higher in the past few sessions.
📊 1-Month Support & Resistance Levels
(These are weekly-to-monthly pivot & technical levels to watch if you’re looking at a 1-month timeframe.)
🔼 Resistance Zones
~₹208 – ₹214: Near current short-term highs / recent pivot ~R1 zone.
₹215 – ₹221: Upper resistance cluster where price may see supply / reversal pressure.
~₹225 – ₹230+: Secondary resistance if trend accelerates.
🔽 Support Zones
~₹195 – ₹200: Immediate support / prior pivot area.
₹187 – ₹190: Mid-range support from recent moving averages & pivot structures.
₹180 – ₹185: Lower support zone, often seen as demand area in a pullback.
📉 Technical Indicators (Short-Term Bias)
Moving averages (like 20/50/100 DMA) often act as dynamic support/resistance — current data suggests 50-day/200-day near ₹180-₹190 (neutral to positive).
Momentum indicators like RSI can help confirm strength — if above 60 + rising, short-term bullish; if falling below ~50, risk of deeper pullback.
📌 Quick Summary (1-Month Frame)
Bullish breakout if price sustains above ~₹215-₹221 — could target higher resistance ~₹225-₹230.
Neutral / sideways near current levels (~₹200-₹208) — price may trade in that band.
Strong support ~₹180-₹195 — breakdown below this can signal deeper correction.

Contact Knowledgehub for a detailed consultation: Dm on WhatsApp: [wa.link/a2o0kz]-
Phone No: [+91 93102 26243]-
Email: [tradingviewknowledgehub@gmail.com]---
-- Let’s achieve success together!
Phone No: [+91 93102 26243]-
Email: [tradingviewknowledgehub@gmail.com]---
-- Let’s achieve success together!
İlgili yayınlar
Feragatname
Bilgiler ve yayınlar, TradingView tarafından sağlanan veya onaylanan finansal, yatırım, alım satım veya diğer türden tavsiye veya öneriler anlamına gelmez ve teşkil etmez. Kullanım Koşulları bölümünde daha fazlasını okuyun.
Contact Knowledgehub for a detailed consultation: Dm on WhatsApp: [wa.link/a2o0kz]-
Phone No: [+91 93102 26243]-
Email: [tradingviewknowledgehub@gmail.com]---
-- Let’s achieve success together!
Phone No: [+91 93102 26243]-
Email: [tradingviewknowledgehub@gmail.com]---
-- Let’s achieve success together!
İlgili yayınlar
Feragatname
Bilgiler ve yayınlar, TradingView tarafından sağlanan veya onaylanan finansal, yatırım, alım satım veya diğer türden tavsiye veya öneriler anlamına gelmez ve teşkil etmez. Kullanım Koşulları bölümünde daha fazlasını okuyun.