Alış
EOSUSDT
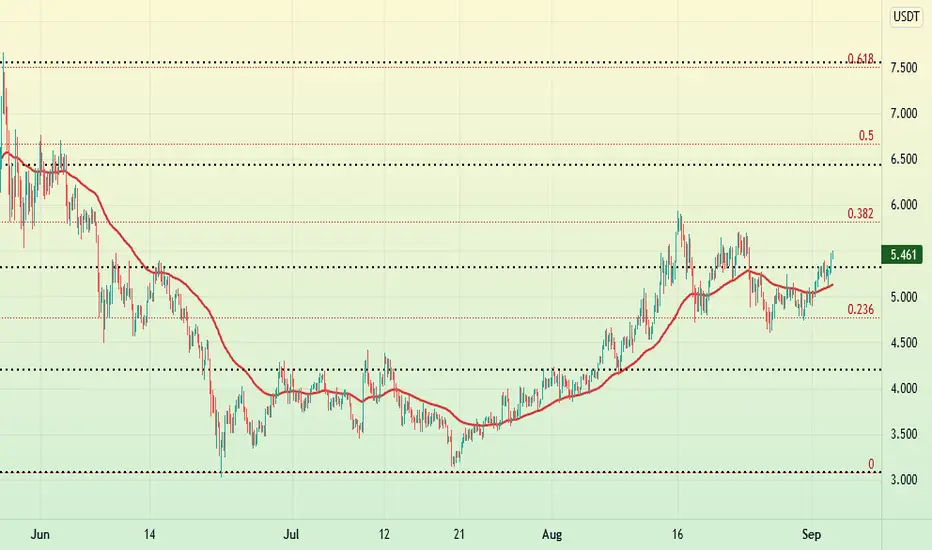
Look at black dotted lines on my chart...
They are support & resistance for moving average thats mean when MA cross above or below this lines,Price starting to Reaction
For example On EOS 4H chart when MA cross above 5.31 line, price will go to the next resistance on 6.4 & 7.5
Crossing MA on upper time frame like Daily, Weekly , ... will be bigger but i prefer to work on 4H time frame

Feragatname
Bilgiler ve yayınlar, TradingView tarafından sağlanan veya onaylanan finansal, yatırım, alım satım veya diğer türden tavsiye veya öneriler anlamına gelmez ve teşkil etmez. Kullanım Koşulları bölümünde daha fazlasını okuyun.
Feragatname
Bilgiler ve yayınlar, TradingView tarafından sağlanan veya onaylanan finansal, yatırım, alım satım veya diğer türden tavsiye veya öneriler anlamına gelmez ve teşkil etmez. Kullanım Koşulları bölümünde daha fazlasını okuyun.