
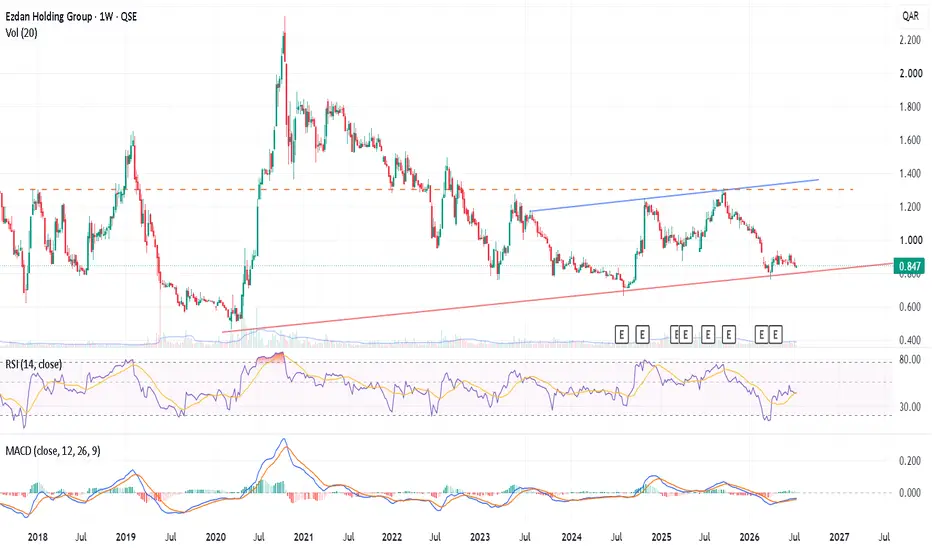
ERES (1W): Testing Key Macro Trendline Support – Accumulation Zone or Breakdown Risk?
Market Overview
Technical Analysis
1. Major Multi-Year Ascending Trendline
On the weekly frame, Ezdan Holding Group is trading right against a critical, long-term ascending support trendline (marked by the solid red line) extending back from the major 2020 macro bottom. Price action has recently experienced a cooling-off period from its late-2025 swing high and is now consolidating tightly just above this primary dynamic floor (0.800 - 0.830 QAR).
2. Overhead Structural Resistance
The Dynamic Ceiling: A secondary, gently ascending blue resistance line tracks the peaks from mid-2023 and late-2025, currently capping the upside around the 1.300 QAR area.
The Macro Pivot Baseline: A long-term horizontal dashed orange line cuts right through the multi-year chart at approximately 1.330 QAR, marking a major historical inflection zone.
3. Technical Indicators
Volume: Volume has stabilized significantly during this consolidation phase, indicating that selling pressure is beginning to dry up as price meets major trendline support.
RSI (14): Currently flattening out at 39.61, sitting right beside its yellow signal line (39.43). The indicator is stabilizing just above oversold territory, reflecting a neutral momentum regime that often precedes an accumulation bounce.
MACD (12, 26, 9): Both the MACD line ( -0.039) and the Signal line (-0.045) remain below the zero mark following the recent correction. However, the lines are beginning to flatten out and converge, while the bearish histogram is rapidly diminishing toward zero. A bullish crossover here would confirm the structural bottom.
Trading Setup & Scenario Planning
The Accumulation Long Setup (Trendline Bounce)
_________________________
This multi-year trendline has protected the downside for over six years. Will the buyers step up once again to trigger a major recovery rally, or is the macro structure under threat? Let me know your setup in the comments!
Market Overview
- Ticker: Ezdan Holding Group (ERES / QSE)
- Timeframe: 1-Week (1W)
- Current Price: 0.847 QAR
- Sentiment: Neutral / Accumulation at Key Structural Support
Technical Analysis
1. Major Multi-Year Ascending Trendline
On the weekly frame, Ezdan Holding Group is trading right against a critical, long-term ascending support trendline (marked by the solid red line) extending back from the major 2020 macro bottom. Price action has recently experienced a cooling-off period from its late-2025 swing high and is now consolidating tightly just above this primary dynamic floor (0.800 - 0.830 QAR).
2. Overhead Structural Resistance
The Dynamic Ceiling: A secondary, gently ascending blue resistance line tracks the peaks from mid-2023 and late-2025, currently capping the upside around the 1.300 QAR area.
The Macro Pivot Baseline: A long-term horizontal dashed orange line cuts right through the multi-year chart at approximately 1.330 QAR, marking a major historical inflection zone.
3. Technical Indicators
Volume: Volume has stabilized significantly during this consolidation phase, indicating that selling pressure is beginning to dry up as price meets major trendline support.
RSI (14): Currently flattening out at 39.61, sitting right beside its yellow signal line (39.43). The indicator is stabilizing just above oversold territory, reflecting a neutral momentum regime that often precedes an accumulation bounce.
MACD (12, 26, 9): Both the MACD line ( -0.039) and the Signal line (-0.045) remain below the zero mark following the recent correction. However, the lines are beginning to flatten out and converge, while the bearish histogram is rapidly diminishing toward zero. A bullish crossover here would confirm the structural bottom.
Trading Setup & Scenario Planning
The Accumulation Long Setup (Trendline Bounce)
- Entry Zone: 0.830 – 0.850 QAR (Excellent risk-to-reward ratio given the proximity to a multi-year macro floor).
- Target 1 (Mid-Term): 1.050 QAR (Psychological round number and recent minor consolidation peak).
- Target 2 (Long-Term): 1.250 – 1.300 QAR (Retest of the long-term blue ascending trendline and structural horizontal resistance).
- Stop Loss: A definitive weekly candle close below 0.790 QAR invalidates this macro bullish defense thesis.
_________________________
This multi-year trendline has protected the downside for over six years. Will the buyers step up once again to trigger a major recovery rally, or is the macro structure under threat? Let me know your setup in the comments!

Feragatname
Bilgiler ve yayınlar, TradingView tarafından sağlanan veya onaylanan finansal, yatırım, alım satım veya diğer türden tavsiye veya öneriler anlamına gelmez ve teşkil etmez. Kullanım Koşulları bölümünde daha fazlasını okuyun.
Feragatname
Bilgiler ve yayınlar, TradingView tarafından sağlanan veya onaylanan finansal, yatırım, alım satım veya diğer türden tavsiye veya öneriler anlamına gelmez ve teşkil etmez. Kullanım Koşulları bölümünde daha fazlasını okuyun.