
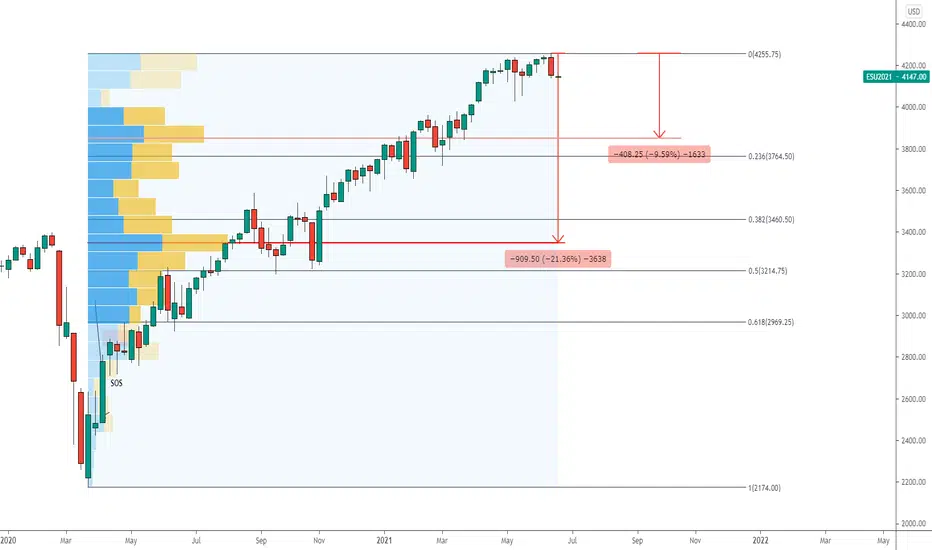
After a strong sell off -59pts or -1.39% (supply) for S&P 500 on last Friday, 18 June 2021, this is a potential start of a market correction.
Here are 2 key support levels to mark on the charts if index continues to fall.
1st Level: 3,850
High Volume Area
Fibo Retracement of 23.6%
10% fall from Peak
2nd Level: 3,400
High Volume Area
Fibo Retracement of 38.2%
20% fall from Peak
Here are 2 key support levels to mark on the charts if index continues to fall.
1st Level: 3,850
High Volume Area
Fibo Retracement of 23.6%
10% fall from Peak
2nd Level: 3,400
High Volume Area
Fibo Retracement of 38.2%
20% fall from Peak

Feragatname
Bilgiler ve yayınlar, TradingView tarafından sağlanan veya onaylanan finansal, yatırım, alım satım veya diğer türden tavsiye veya öneriler anlamına gelmez ve teşkil etmez. Kullanım Koşulları bölümünde daha fazlasını okuyun.
Feragatname
Bilgiler ve yayınlar, TradingView tarafından sağlanan veya onaylanan finansal, yatırım, alım satım veya diğer türden tavsiye veya öneriler anlamına gelmez ve teşkil etmez. Kullanım Koşulları bölümünde daha fazlasını okuyun.