
Ethereum Futures at a Crossroads: Diverging from Bitcoin
Ethereum futures track the price of Ether, the native token of the Ethereum blockchain, which remains the dominant infrastructure layer for decentralized finance, NFTs, and tokenized assets. Like most digital assets, Ethereum futures are heavily influenced by global liquidity conditions, institutional flows, regulatory developments, and sentiment across the broader cryptocurrency market.
While Ethereum often trades directionally with Bitcoin, the strength of the correlation varies significantly across cycles. Bitcoin is widely viewed as the reserve asset of the crypto ecosystem and increasingly functions as a macro risk proxy. Ethereum, by contrast, behaves more like a high beta technology platform tied to network activity, decentralized applications, and evolving token economics. This distinction explains why Ethereum has recently struggled to hold price levels as effectively as Bitcoin during periods of market stress.
One structural factor affecting sentiment is the evolution of Ethereum’s token economics. After the Dencun upgrade in 2024, much of the ecosystem activity migrated to Layer 2 networks where transaction costs are significantly lower. While this improves scalability, it also reduces the amount of ETH burned on the mainnet, weakening the deflationary narrative that previously supported price appreciation.
Recent macro developments have also contributed to volatility across the crypto complex. In late January and early February 2026, markets reacted negatively to the nomination of Kevin Warsh as a potential Federal Reserve chair, which raised concerns that monetary policy could remain restrictive for longer. That shift in rate expectations triggered a broad selloff across risk assets including cryptocurrencies.
The crypto market also experienced a wave of forced liquidations in early February, with billions of dollars in leveraged positions unwound across derivatives exchanges. These liquidation cascades tend to amplify downside volatility in assets like Ethereum that are widely traded with leverage.
More recently, geopolitical tensions in the Middle East and broader risk asset volatility have also contributed to short term fluctuations across Bitcoin and Ethereum markets.
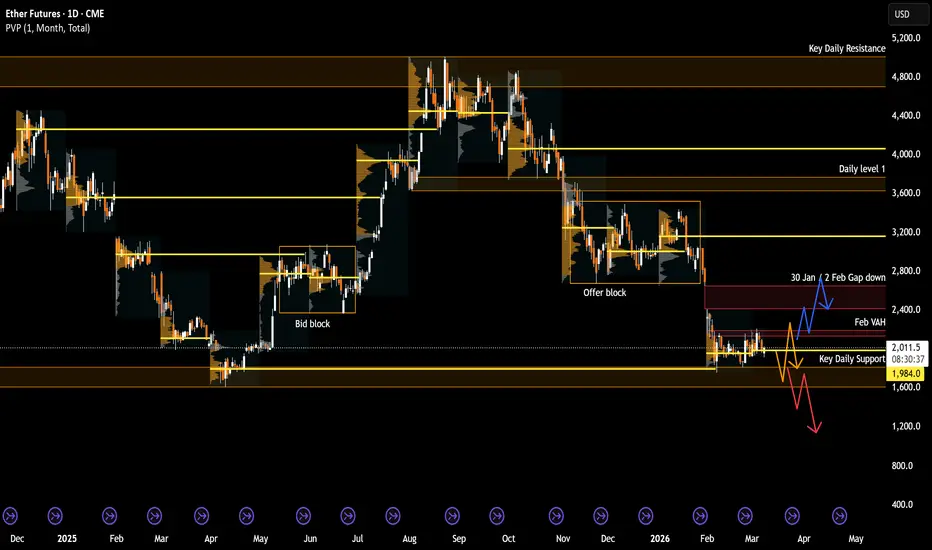
Against this backdrop, Ethereum futures are now trading near the lows of a multi year range, with market participants closely watching key technical levels for the next directional move.
What the Market Has Done
• The market has been in a large multi year range since 2021 between the 5500 area and the 1700 area.
• Since November 2025, the market failed to hold above the 3750 area (daily level 1) and rotated back down to the 2700 area, where buyers defended at bid block. The bearish rotation coincided with tightening financial conditions and renewed macro uncertainty after hawkish Federal Reserve expectations emerged, which pressured crypto markets broadly.
• Subsequently, sellers stepped down offers to the 3500 area, resulting in a two way auction and forming a consolidation block between 3750 and 2700. This range later transitioned into an offer block once the market broke lower.
• More recently, the market gapped down in February to the 1750 area, a key daily support level where buyers defended. The move occurred during a broader crypto selloff triggered by heavy derivatives liquidations and widespread risk reduction across leveraged positions. Liquidation events exceeding several billion dollars in early February accelerated downside momentum across the crypto market.
• The market is currently balanced within the February value area and trading in a tight range.
What to Expect in the Coming Weeks?
The key levels to watch are 2150 (February VAH) and 1750 (key daily support).
Neutral Scenario
• Without further catalyst, expect the market to continue to auction two-way within the February value area with possible overshoots at the edges.
• This behavior would reflect continued balance conditions as the market digests macro uncertainty and waits for new catalysts such as regulatory developments, institutional flows, shifts in global liquidity conditions, or escalation or resolution of geopolitical conflicts in the Middle East.
Bullish Scenario
• If buyers are able to imbalance out of the February value area above 2150, expect a move toward 2411, which marks the January 31 to February 2 gap low.
• A continuation higher could bring prices toward 2646 to fully close the gap.
• If acceptance develops above 2646 after the gap closes, the market may rotate back into the prior offer block, potentially targeting the 3100 to 3150 area near the offer block midpoint and January VPOC.
Bearish Scenario
• If buyers are unable to defend the 1750 area, expect long liquidation and a move down toward 1300.
• If the market is not able to recover back above 1600 quickly after a breakdown, further downside continuation could follow as leveraged positions are forced out of the market.
Conclusion
Ethereum futures remain trapped within a broader multi year range, but recent price action shows the market testing the lower end of that structure. From a technical perspective, the 1750 support and 2150 February VAH will likely determine the next directional move. A breakout above value could trigger a rotation back toward prior value areas, while failure to hold support could accelerate liquidation driven downside.
Fundamentally, Ethereum continues to navigate a complex transition. Changes to its token economics, institutional positioning in crypto funds, and macro drivers such as Federal Reserve policy and geopolitical developments are all influencing sentiment. As global liquidity conditions and risk appetite shift, Ethereum may continue to exhibit higher volatility relative to Bitcoin.
The next directional move will likely be determined by whether buyers can reclaim the 2150 February VAH or if sellers are able to force acceptance below the 1750 support.
Disclaimer: This is not financial advice. Analysis is for educational purposes only; trade your own plan and manage risk.
Acronyms:
C - Composite
w - Weekly
m - Monthly
VAH - Value Area High
VAL - Value Area Low
VPOC - Volume Point of Control
LVN - Low Value Node
HVN - High Value Node
LVA - Low Value Area
SP - Single print
ATH - All time high
Ethereum futures track the price of Ether, the native token of the Ethereum blockchain, which remains the dominant infrastructure layer for decentralized finance, NFTs, and tokenized assets. Like most digital assets, Ethereum futures are heavily influenced by global liquidity conditions, institutional flows, regulatory developments, and sentiment across the broader cryptocurrency market.
While Ethereum often trades directionally with Bitcoin, the strength of the correlation varies significantly across cycles. Bitcoin is widely viewed as the reserve asset of the crypto ecosystem and increasingly functions as a macro risk proxy. Ethereum, by contrast, behaves more like a high beta technology platform tied to network activity, decentralized applications, and evolving token economics. This distinction explains why Ethereum has recently struggled to hold price levels as effectively as Bitcoin during periods of market stress.
One structural factor affecting sentiment is the evolution of Ethereum’s token economics. After the Dencun upgrade in 2024, much of the ecosystem activity migrated to Layer 2 networks where transaction costs are significantly lower. While this improves scalability, it also reduces the amount of ETH burned on the mainnet, weakening the deflationary narrative that previously supported price appreciation.
Recent macro developments have also contributed to volatility across the crypto complex. In late January and early February 2026, markets reacted negatively to the nomination of Kevin Warsh as a potential Federal Reserve chair, which raised concerns that monetary policy could remain restrictive for longer. That shift in rate expectations triggered a broad selloff across risk assets including cryptocurrencies.
The crypto market also experienced a wave of forced liquidations in early February, with billions of dollars in leveraged positions unwound across derivatives exchanges. These liquidation cascades tend to amplify downside volatility in assets like Ethereum that are widely traded with leverage.
More recently, geopolitical tensions in the Middle East and broader risk asset volatility have also contributed to short term fluctuations across Bitcoin and Ethereum markets.
Against this backdrop, Ethereum futures are now trading near the lows of a multi year range, with market participants closely watching key technical levels for the next directional move.
What the Market Has Done
• The market has been in a large multi year range since 2021 between the 5500 area and the 1700 area.
• Since November 2025, the market failed to hold above the 3750 area (daily level 1) and rotated back down to the 2700 area, where buyers defended at bid block. The bearish rotation coincided with tightening financial conditions and renewed macro uncertainty after hawkish Federal Reserve expectations emerged, which pressured crypto markets broadly.
• Subsequently, sellers stepped down offers to the 3500 area, resulting in a two way auction and forming a consolidation block between 3750 and 2700. This range later transitioned into an offer block once the market broke lower.
• More recently, the market gapped down in February to the 1750 area, a key daily support level where buyers defended. The move occurred during a broader crypto selloff triggered by heavy derivatives liquidations and widespread risk reduction across leveraged positions. Liquidation events exceeding several billion dollars in early February accelerated downside momentum across the crypto market.
• The market is currently balanced within the February value area and trading in a tight range.
What to Expect in the Coming Weeks?
The key levels to watch are 2150 (February VAH) and 1750 (key daily support).
Neutral Scenario
• Without further catalyst, expect the market to continue to auction two-way within the February value area with possible overshoots at the edges.
• This behavior would reflect continued balance conditions as the market digests macro uncertainty and waits for new catalysts such as regulatory developments, institutional flows, shifts in global liquidity conditions, or escalation or resolution of geopolitical conflicts in the Middle East.
Bullish Scenario
• If buyers are able to imbalance out of the February value area above 2150, expect a move toward 2411, which marks the January 31 to February 2 gap low.
• A continuation higher could bring prices toward 2646 to fully close the gap.
• If acceptance develops above 2646 after the gap closes, the market may rotate back into the prior offer block, potentially targeting the 3100 to 3150 area near the offer block midpoint and January VPOC.
Bearish Scenario
• If buyers are unable to defend the 1750 area, expect long liquidation and a move down toward 1300.
• If the market is not able to recover back above 1600 quickly after a breakdown, further downside continuation could follow as leveraged positions are forced out of the market.
Conclusion
Ethereum futures remain trapped within a broader multi year range, but recent price action shows the market testing the lower end of that structure. From a technical perspective, the 1750 support and 2150 February VAH will likely determine the next directional move. A breakout above value could trigger a rotation back toward prior value areas, while failure to hold support could accelerate liquidation driven downside.
Fundamentally, Ethereum continues to navigate a complex transition. Changes to its token economics, institutional positioning in crypto funds, and macro drivers such as Federal Reserve policy and geopolitical developments are all influencing sentiment. As global liquidity conditions and risk appetite shift, Ethereum may continue to exhibit higher volatility relative to Bitcoin.
The next directional move will likely be determined by whether buyers can reclaim the 2150 February VAH or if sellers are able to force acceptance below the 1750 support.
Disclaimer: This is not financial advice. Analysis is for educational purposes only; trade your own plan and manage risk.
Acronyms:
C - Composite
w - Weekly
m - Monthly
VAH - Value Area High
VAL - Value Area Low
VPOC - Volume Point of Control
LVN - Low Value Node
HVN - High Value Node
LVA - Low Value Area
SP - Single print
ATH - All time high

EdgeClear
P: 773.832.8320
Derivatives trading involves a substantial risk of loss. Past performance is not indicative of future results. Any example trades are not inclusive of fees and commissions.
P: 773.832.8320
Derivatives trading involves a substantial risk of loss. Past performance is not indicative of future results. Any example trades are not inclusive of fees and commissions.
Feragatname
Bilgiler ve yayınlar, TradingView tarafından sağlanan veya onaylanan finansal, yatırım, alım satım veya diğer türden tavsiye veya öneriler anlamına gelmez ve teşkil etmez. Kullanım Koşulları bölümünde daha fazlasını okuyun.
EdgeClear
P: 773.832.8320
Derivatives trading involves a substantial risk of loss. Past performance is not indicative of future results. Any example trades are not inclusive of fees and commissions.
P: 773.832.8320
Derivatives trading involves a substantial risk of loss. Past performance is not indicative of future results. Any example trades are not inclusive of fees and commissions.
Feragatname
Bilgiler ve yayınlar, TradingView tarafından sağlanan veya onaylanan finansal, yatırım, alım satım veya diğer türden tavsiye veya öneriler anlamına gelmez ve teşkil etmez. Kullanım Koşulları bölümünde daha fazlasını okuyun.