
📈 ETH/USD Analysis – Potential Pullback Before the Next Bullish Leg
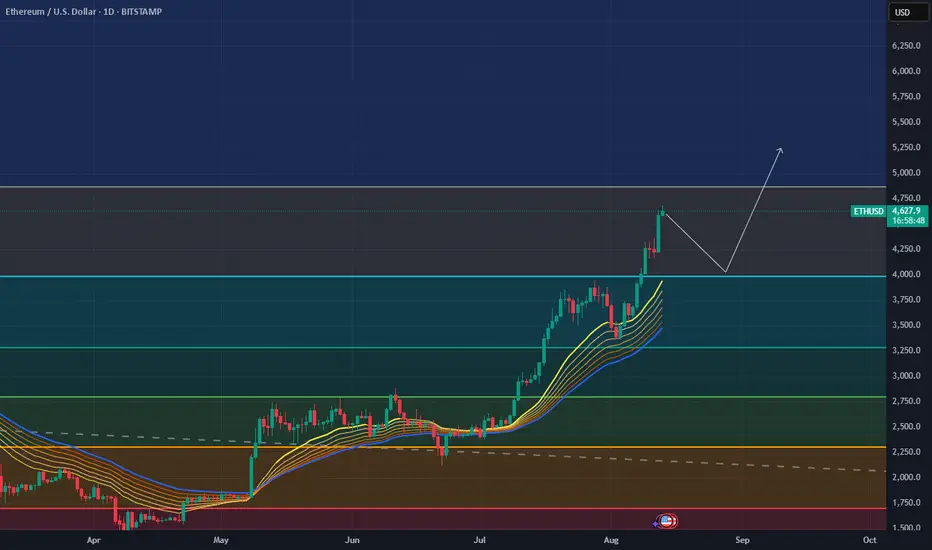
Ethereum is currently trading at $4,622 after an impressive rally. The price has reached a key resistance zone (~$4,700), where a short-term correction could occur.
Key insights:
EMA ribbons show a strong bullish trend – all moving averages are aligned upward and acting as dynamic support.
Fibonacci levels indicate the nearest major support around $4,000 (blue horizontal line).
Scenario: a possible retracement toward the ~$4,000 area, followed by a bounce targeting $5,250 and beyond.
Conclusion:
In the short term, we might see a healthy pullback, but the overall market structure remains strongly bullish. Strategically, watching the reaction at the $4,000 support zone could offer a good buying opportunity.
Ethereum is currently trading at $4,622 after an impressive rally. The price has reached a key resistance zone (~$4,700), where a short-term correction could occur.
Key insights:
EMA ribbons show a strong bullish trend – all moving averages are aligned upward and acting as dynamic support.
Fibonacci levels indicate the nearest major support around $4,000 (blue horizontal line).
Scenario: a possible retracement toward the ~$4,000 area, followed by a bounce targeting $5,250 and beyond.
Conclusion:
In the short term, we might see a healthy pullback, but the overall market structure remains strongly bullish. Strategically, watching the reaction at the $4,000 support zone could offer a good buying opportunity.
İşlem aktif

İlgili yayınlar
Feragatname
Bilgiler ve yayınlar, TradingView tarafından sağlanan veya onaylanan finansal, yatırım, alım satım veya diğer türden tavsiye veya öneriler anlamına gelmez ve teşkil etmez. Kullanım Koşulları bölümünde daha fazlasını okuyun.
İlgili yayınlar
Feragatname
Bilgiler ve yayınlar, TradingView tarafından sağlanan veya onaylanan finansal, yatırım, alım satım veya diğer türden tavsiye veya öneriler anlamına gelmez ve teşkil etmez. Kullanım Koşulları bölümünde daha fazlasını okuyun.