
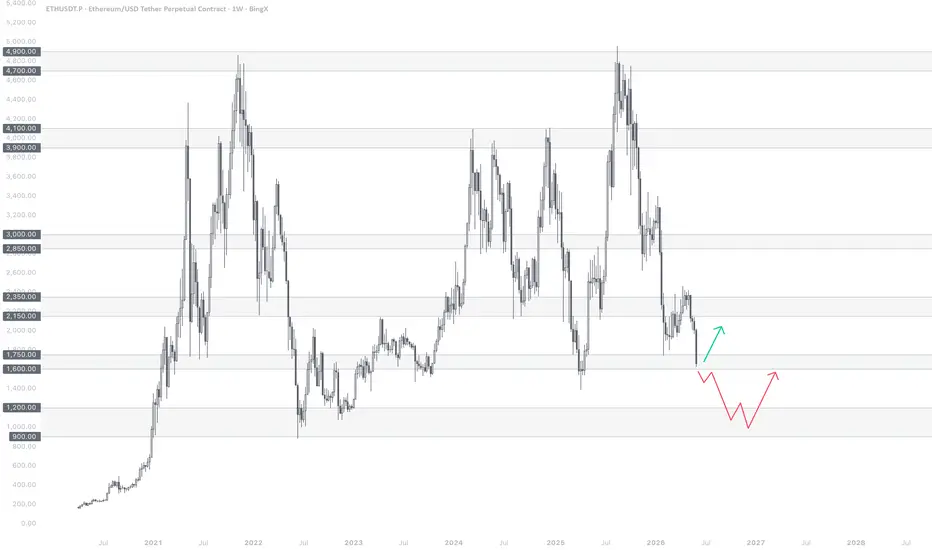
ETH | Weekly – Time to zoom out. 🔭
Let's step back from the noise and look at the bigger picture – pure Support & Resistance on the weekly chart.
The last few days ETH pushed down with impulse. It looks like the previous pullback has finished and price is now approaching the next major support zone between $1,750 and $1,600. Historically, this area has mattered.
This is where reversals happen. Or don't.
Two scenarios from here:
🟢 The $1,750–$1,600 zone holds, ETH finds buyers and structure begins to recover. First meaningful resistance sits at $2,150, then $2,350.
🔴 The zone fails to hold. Weekly candle closes weak, sentiment shifts and $1,200 becomes the next destination.
The weekly close will tell us everything. No need to guess before then.
Patience is still a position.
Trade your plan. I share mine.
Let's step back from the noise and look at the bigger picture – pure Support & Resistance on the weekly chart.
The last few days ETH pushed down with impulse. It looks like the previous pullback has finished and price is now approaching the next major support zone between $1,750 and $1,600. Historically, this area has mattered.
This is where reversals happen. Or don't.
Two scenarios from here:
🟢 The $1,750–$1,600 zone holds, ETH finds buyers and structure begins to recover. First meaningful resistance sits at $2,150, then $2,350.
🔴 The zone fails to hold. Weekly candle closes weak, sentiment shifts and $1,200 becomes the next destination.
The weekly close will tell us everything. No need to guess before then.
Patience is still a position.
Trade your plan. I share mine.

Feragatname
Bilgiler ve yayınlar, TradingView tarafından sağlanan veya onaylanan finansal, yatırım, alım satım veya diğer türden tavsiye veya öneriler anlamına gelmez ve teşkil etmez. Kullanım Koşulları bölümünde daha fazlasını okuyun.
Feragatname
Bilgiler ve yayınlar, TradingView tarafından sağlanan veya onaylanan finansal, yatırım, alım satım veya diğer türden tavsiye veya öneriler anlamına gelmez ve teşkil etmez. Kullanım Koşulları bölümünde daha fazlasını okuyun.