
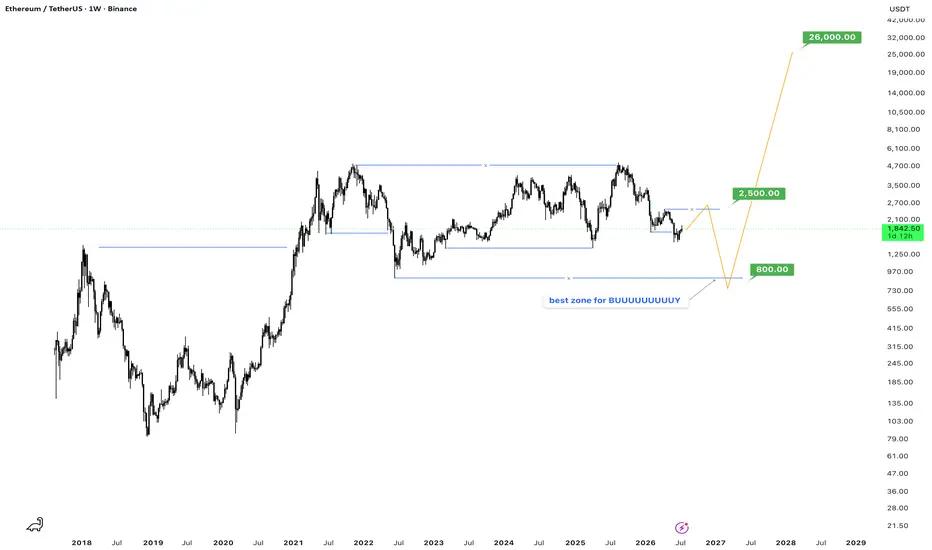
**SMC (Smart Money Concept) Analysis: ETH/USDT Weekly Chart**
**Timeframe:** Weekly (W1)
**Current Price (as of July 18, 2026):** ~$1,841.95
**Chart Outlook:** Macro Bullish with Strong Institutional Accumulation Structure
### Key SMC Elements Identified:
**1. Higher Timeframe Structure**
- ETH has been respecting a clear **Bullish Market Structure** since the 2020-2021 cycle.
- Multiple **Order Blocks (OB)** and **Breaker Blocks** are visible:
- Strong **Bullish Order Block** around $800–$1,000 zone (major demand area from previous cycle).
- Mitigation of previous highs with clean displacement upward.
- The chart shows classic **BOS (Break of Structure)** followed by **CHOCH (Change of Character)** confirmations in the bullish direction.
**2. Liquidity & Displacement**
- Recent price action swept liquidity below recent lows (~$1,800 area) before the strong upward displacement.
- The "best zone for BUUUUUUUUY" highlighted aligns perfectly with a **Premium/Discount array** — deep in the discount relative to the overall macro range.
**3. Key Levels (SMC Framework)**
**Demand Zones (Buy Areas):**
- **Primary Bullish Order Block:** $800 – $970 (Major institutional demand — very strong)
- **Secondary Demand:** $1,200 – $1,500 range (previous consolidation)
- **Current Entry Zone:** $1,700 – $1,950 (where price is currently consolidating)
**Supply Zones (Sell/Take Profit Areas):**
- **Intermediate Target:** $2,500 (noted on chart)
- **Major Liquidity Pool:** $4,700 – $6,100
- **Macro Target:** **$26,000** (aggressive parabolic projection by late 2028)
**4. Fair Value Gap & Imbalances**
- There are multiple unfilled FVGs above current price that price is likely to seek as it moves higher.
- The move from ~$800 to the current levels left significant inefficiency that Smart Money is now filling on the way up.
### Trading Strategy (SMC Style):
**Bias:** Strongly Bullish (Higher Highs + Higher Lows expected)
**Entry Setup:**
- Look for **inducement** below the current range followed by strong bullish confirmation (displacement + FVG fill).
- Optimal entries near the $1,800 – $1,950 zone with confluences (Order Block + Liquidity sweep).
**Risk Management:**
- Stop Loss: Below the most recent low / invalidation of the bullish structure (~$1,600 or lower depending on entry).
- Take Profit Levels:
1. $2,500 (first major liquidity)
2. $4,700 – $6,100
3. Extended Target: $26,000 (macro cycle top)
### Summary:
The chart displays textbook **Smart Money accumulation** behavior. Ethereum is currently in a deep discount zone after sweeping liquidity, positioning for the next major impulsive leg higher. The $800–$1,000 area remains one of the strongest demand zones on the chart.
**"Best zone for BUUUUUUUUY"** — exactly where Smart Money has been defending and loading.
---
**Timeframe:** Weekly (W1)
**Current Price (as of July 18, 2026):** ~$1,841.95
**Chart Outlook:** Macro Bullish with Strong Institutional Accumulation Structure
### Key SMC Elements Identified:
**1. Higher Timeframe Structure**
- ETH has been respecting a clear **Bullish Market Structure** since the 2020-2021 cycle.
- Multiple **Order Blocks (OB)** and **Breaker Blocks** are visible:
- Strong **Bullish Order Block** around $800–$1,000 zone (major demand area from previous cycle).
- Mitigation of previous highs with clean displacement upward.
- The chart shows classic **BOS (Break of Structure)** followed by **CHOCH (Change of Character)** confirmations in the bullish direction.
**2. Liquidity & Displacement**
- Recent price action swept liquidity below recent lows (~$1,800 area) before the strong upward displacement.
- The "best zone for BUUUUUUUUY" highlighted aligns perfectly with a **Premium/Discount array** — deep in the discount relative to the overall macro range.
**3. Key Levels (SMC Framework)**
**Demand Zones (Buy Areas):**
- **Primary Bullish Order Block:** $800 – $970 (Major institutional demand — very strong)
- **Secondary Demand:** $1,200 – $1,500 range (previous consolidation)
- **Current Entry Zone:** $1,700 – $1,950 (where price is currently consolidating)
**Supply Zones (Sell/Take Profit Areas):**
- **Intermediate Target:** $2,500 (noted on chart)
- **Major Liquidity Pool:** $4,700 – $6,100
- **Macro Target:** **$26,000** (aggressive parabolic projection by late 2028)
**4. Fair Value Gap & Imbalances**
- There are multiple unfilled FVGs above current price that price is likely to seek as it moves higher.
- The move from ~$800 to the current levels left significant inefficiency that Smart Money is now filling on the way up.
### Trading Strategy (SMC Style):
**Bias:** Strongly Bullish (Higher Highs + Higher Lows expected)
**Entry Setup:**
- Look for **inducement** below the current range followed by strong bullish confirmation (displacement + FVG fill).
- Optimal entries near the $1,800 – $1,950 zone with confluences (Order Block + Liquidity sweep).
**Risk Management:**
- Stop Loss: Below the most recent low / invalidation of the bullish structure (~$1,600 or lower depending on entry).
- Take Profit Levels:
1. $2,500 (first major liquidity)
2. $4,700 – $6,100
3. Extended Target: $26,000 (macro cycle top)
### Summary:
The chart displays textbook **Smart Money accumulation** behavior. Ethereum is currently in a deep discount zone after sweeping liquidity, positioning for the next major impulsive leg higher. The $800–$1,000 area remains one of the strongest demand zones on the chart.
**"Best zone for BUUUUUUUUY"** — exactly where Smart Money has been defending and loading.
---

Feragatname
Bilgiler ve yayınlar, TradingView tarafından sağlanan veya onaylanan finansal, yatırım, alım satım veya diğer türden tavsiye veya öneriler anlamına gelmez ve teşkil etmez. Kullanım Koşulları bölümünde daha fazlasını okuyun.
Feragatname
Bilgiler ve yayınlar, TradingView tarafından sağlanan veya onaylanan finansal, yatırım, alım satım veya diğer türden tavsiye veya öneriler anlamına gelmez ve teşkil etmez. Kullanım Koşulları bölümünde daha fazlasını okuyun.