
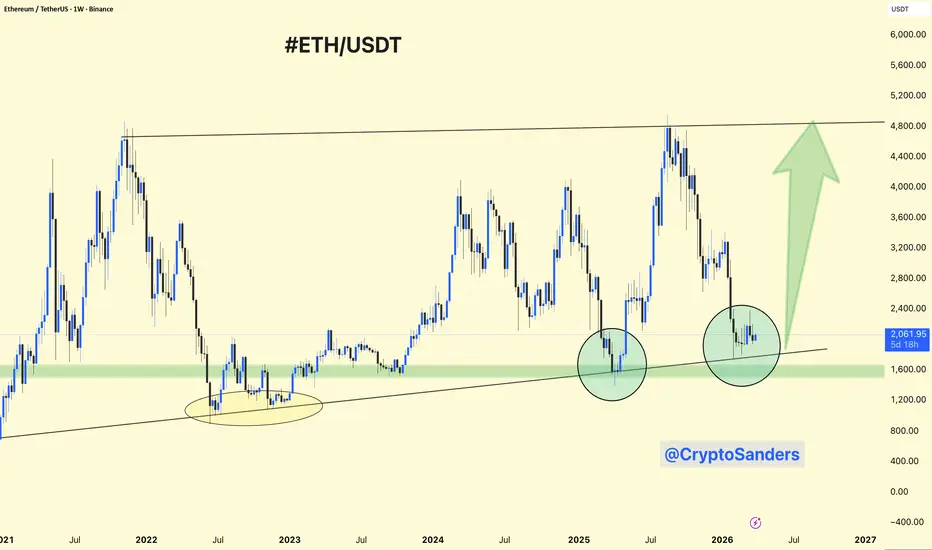
ETHUSDT weekly chart shows a massive multi‑year rising channel structure intact since the 2021 lows, with price now squeezing into the upper half after a prolonged consolidation phase.
The long‑term ascending channel has defined ETH’s macro uptrend, with the recent leg bouncing from the midline around $2,400–$2,500 and now testing the upper parallel near $4,200–$4,400.
Recent weekly candles have printed higher lows consistently, confirming buyers defending the channel base, while the green arrow projection targets a measured move to $5,000–$5,500 if the top breaks cleanly.
Bullish bias holds as long as price stays above the channel midline and $2,800 support; a weekly close above $4,400 would validate the breakout and open the full channel top toward $6k+.
Risk of a pullback exists if it rejects from the top again, but the structure favors continuation higher given the clean trendline respect over the years.
The long‑term ascending channel has defined ETH’s macro uptrend, with the recent leg bouncing from the midline around $2,400–$2,500 and now testing the upper parallel near $4,200–$4,400.
Recent weekly candles have printed higher lows consistently, confirming buyers defending the channel base, while the green arrow projection targets a measured move to $5,000–$5,500 if the top breaks cleanly.
Bullish bias holds as long as price stays above the channel midline and $2,800 support; a weekly close above $4,400 would validate the breakout and open the full channel top toward $6k+.
Risk of a pullback exists if it rejects from the top again, but the structure favors continuation higher given the clean trendline respect over the years.

İlgili yayınlar
Feragatname
Bilgiler ve yayınlar, TradingView tarafından sağlanan veya onaylanan finansal, yatırım, alım satım veya diğer türden tavsiye veya öneriler anlamına gelmez ve teşkil etmez. Kullanım Koşulları bölümünde daha fazlasını okuyun.
İlgili yayınlar
Feragatname
Bilgiler ve yayınlar, TradingView tarafından sağlanan veya onaylanan finansal, yatırım, alım satım veya diğer türden tavsiye veya öneriler anlamına gelmez ve teşkil etmez. Kullanım Koşulları bölümünde daha fazlasını okuyun.