
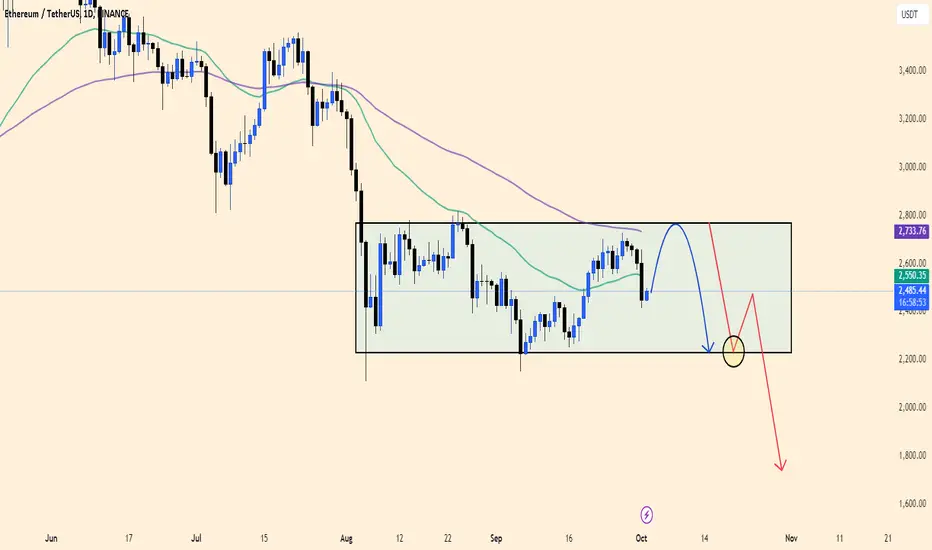
The ETHUSDT chart shows Ethereum currently trading within a sideways channel, with support around 2,400 USDT and resistance near 2,750 USDT. After a slight recovery, ETH seems unable to break through this resistance level and is now turning downwards.
Combined with uncertainty in the cryptocurrency market and macroeconomic factors, ETH is likely to continue fluctuating within this range before possibly breaking the support zone. If the 2,400 USDT level is breached, a strong downtrend could push ETH to lower levels around 2,200 USDT or even further.
Trading strategy: Traders can wait for ETH to reach the resistance zone near 2,700 USDT to enter a sell position, with a target of 2,400 USDT. If the price breaks below this support, continue holding the sell position with a lower target around 2,200 USDT.
Combined with uncertainty in the cryptocurrency market and macroeconomic factors, ETH is likely to continue fluctuating within this range before possibly breaking the support zone. If the 2,400 USDT level is breached, a strong downtrend could push ETH to lower levels around 2,200 USDT or even further.
Trading strategy: Traders can wait for ETH to reach the resistance zone near 2,700 USDT to enter a sell position, with a target of 2,400 USDT. If the price breaks below this support, continue holding the sell position with a lower target around 2,200 USDT.

İlgili yayınlar
Feragatname
Bilgiler ve yayınlar, TradingView tarafından sağlanan veya onaylanan finansal, yatırım, alım satım veya diğer türden tavsiye veya öneriler anlamına gelmez ve teşkil etmez. Kullanım Koşulları bölümünde daha fazlasını okuyun.
İlgili yayınlar
Feragatname
Bilgiler ve yayınlar, TradingView tarafından sağlanan veya onaylanan finansal, yatırım, alım satım veya diğer türden tavsiye veya öneriler anlamına gelmez ve teşkil etmez. Kullanım Koşulları bölümünde daha fazlasını okuyun.