
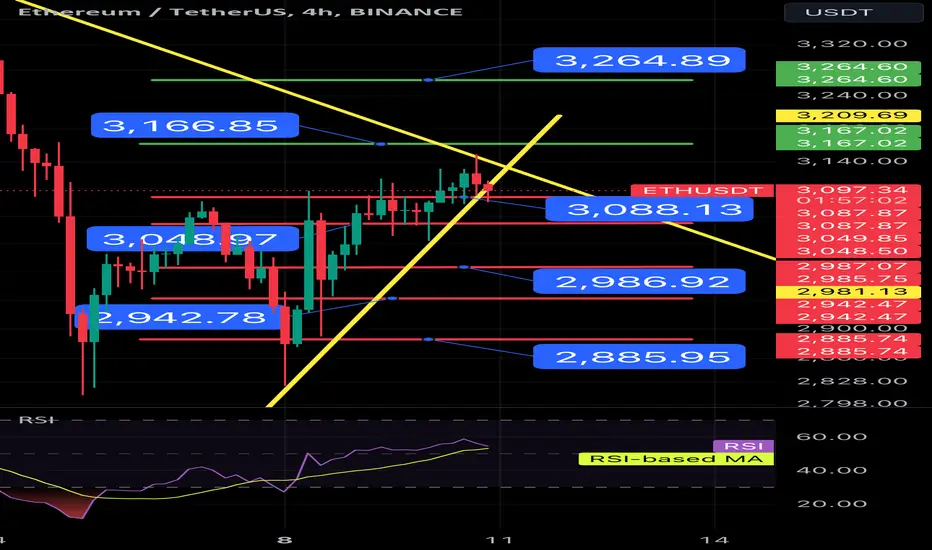
Hello everyone, I invite you to a quick review of the ETH to USDT chart for the 4H period. As we can see, the price is approaching leaving the local triangle, which indicates a possible direction for further movement.
When the price starts to reverse, support levels are visible at $3,088, then support levels are visible at $3,048, and support levels are at $2,986, $2,942, and $2,885.
However, when the price moves up again, it must overcome the resistance at $3,166 to continue towards the strong resistance at $3,264.
Looking at the RSI indicator, we can see that we have entered the upper part of the range, but there is still room for the price to go up.
When the price starts to reverse, support levels are visible at $3,088, then support levels are visible at $3,048, and support levels are at $2,986, $2,942, and $2,885.
However, when the price moves up again, it must overcome the resistance at $3,166 to continue towards the strong resistance at $3,264.
Looking at the RSI indicator, we can see that we have entered the upper part of the range, but there is still room for the price to go up.

Feragatname
Bilgiler ve yayınlar, TradingView tarafından sağlanan veya onaylanan finansal, yatırım, alım satım veya diğer türden tavsiye veya öneriler anlamına gelmez ve teşkil etmez. Kullanım Koşulları bölümünde daha fazlasını okuyun.
Feragatname
Bilgiler ve yayınlar, TradingView tarafından sağlanan veya onaylanan finansal, yatırım, alım satım veya diğer türden tavsiye veya öneriler anlamına gelmez ve teşkil etmez. Kullanım Koşulları bölümünde daha fazlasını okuyun.