
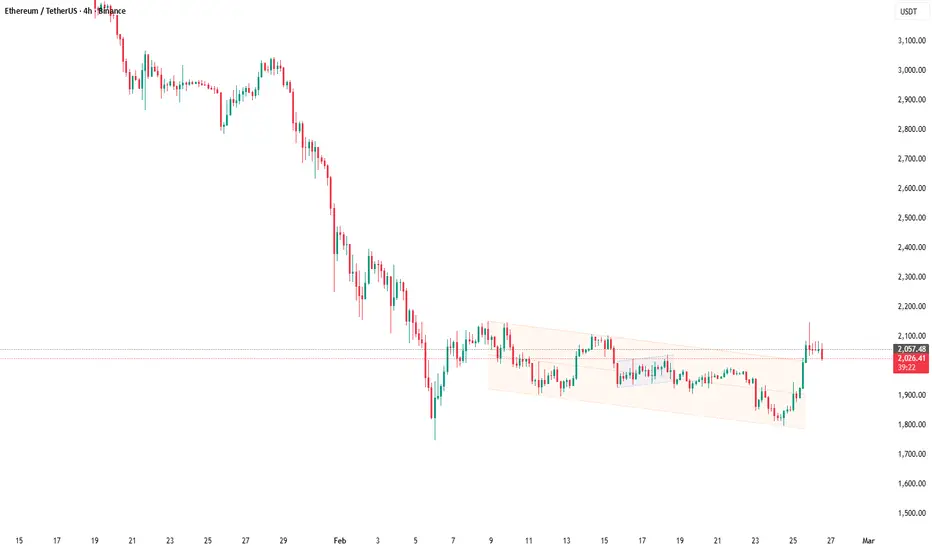
Market Structure Mapping with Dynamic Channels (Major vs Minor)
Market structure becomes easier to read when you can see “where price is likely to flow” without manually drawing lines. This chart uses the AG Pro Dynamic Channels V2 indicator, which automatically detects pivot highs/lows and projects them into dynamic support/resistance channels.
Concept (simple):
- Major External Channels: define the primary structure (the “macro corridor”).
- Major Internal Channels: map the dominant pullbacks inside that corridor.
- Minor Channels: show short-term swings and micro structure.
How I read it (workflow):
1) Start with the Major External channel to define bias
- If price is respecting the upper/lower boundary, treat that as the dominant regime.
2) Use Internal channels to locate pullback zones
- Internal lines often act as “decision points” during corrections.
3) Use Minor channels for timing and context
- Minor structure can help you avoid chasing extensions and spot early weakness/strength.
Practical notes:
- Structure tools are descriptive, not predictive. Wait for confirmation (e.g., a clean close, or multiple reactions) before acting on a level.
- If the chart becomes busy, disable channel types you don’t need and/or use the “Delete Previous” option so only the latest structures remain.
Risk disclosure:
This is an educational market-structure visualization. It is not financial advice. Always use defined risk and avoid trading solely on one tool.
Market structure becomes easier to read when you can see “where price is likely to flow” without manually drawing lines. This chart uses the AG Pro Dynamic Channels V2 indicator, which automatically detects pivot highs/lows and projects them into dynamic support/resistance channels.
Concept (simple):
- Major External Channels: define the primary structure (the “macro corridor”).
- Major Internal Channels: map the dominant pullbacks inside that corridor.
- Minor Channels: show short-term swings and micro structure.
How I read it (workflow):
1) Start with the Major External channel to define bias
- If price is respecting the upper/lower boundary, treat that as the dominant regime.
2) Use Internal channels to locate pullback zones
- Internal lines often act as “decision points” during corrections.
3) Use Minor channels for timing and context
- Minor structure can help you avoid chasing extensions and spot early weakness/strength.
Practical notes:
- Structure tools are descriptive, not predictive. Wait for confirmation (e.g., a clean close, or multiple reactions) before acting on a level.
- If the chart becomes busy, disable channel types you don’t need and/or use the “Delete Previous” option so only the latest structures remain.
Risk disclosure:
This is an educational market-structure visualization. It is not financial advice. Always use defined risk and avoid trading solely on one tool.

🧠 Trading Suite - Flagship Workflow
tradingview.com/script/XJmX3p98-Trading-Suite-AGPro-Series/
🔷 Crypto Setup Planner - Multi-Symbol Planner
tradingview.com/script/LgVRo7Ql-Crypto-Setup-Planner-AGPro-Series/
tradingview.com/script/XJmX3p98-Trading-Suite-AGPro-Series/
🔷 Crypto Setup Planner - Multi-Symbol Planner
tradingview.com/script/LgVRo7Ql-Crypto-Setup-Planner-AGPro-Series/
Feragatname
Bilgiler ve yayınlar, TradingView tarafından sağlanan veya onaylanan finansal, yatırım, alım satım veya diğer türden tavsiye veya öneriler anlamına gelmez ve teşkil etmez. Kullanım Koşulları bölümünde daha fazlasını okuyun.
🧠 Trading Suite - Flagship Workflow
tradingview.com/script/XJmX3p98-Trading-Suite-AGPro-Series/
🔷 Crypto Setup Planner - Multi-Symbol Planner
tradingview.com/script/LgVRo7Ql-Crypto-Setup-Planner-AGPro-Series/
tradingview.com/script/XJmX3p98-Trading-Suite-AGPro-Series/
🔷 Crypto Setup Planner - Multi-Symbol Planner
tradingview.com/script/LgVRo7Ql-Crypto-Setup-Planner-AGPro-Series/
Feragatname
Bilgiler ve yayınlar, TradingView tarafından sağlanan veya onaylanan finansal, yatırım, alım satım veya diğer türden tavsiye veya öneriler anlamına gelmez ve teşkil etmez. Kullanım Koşulları bölümünde daha fazlasını okuyun.