
#ETH
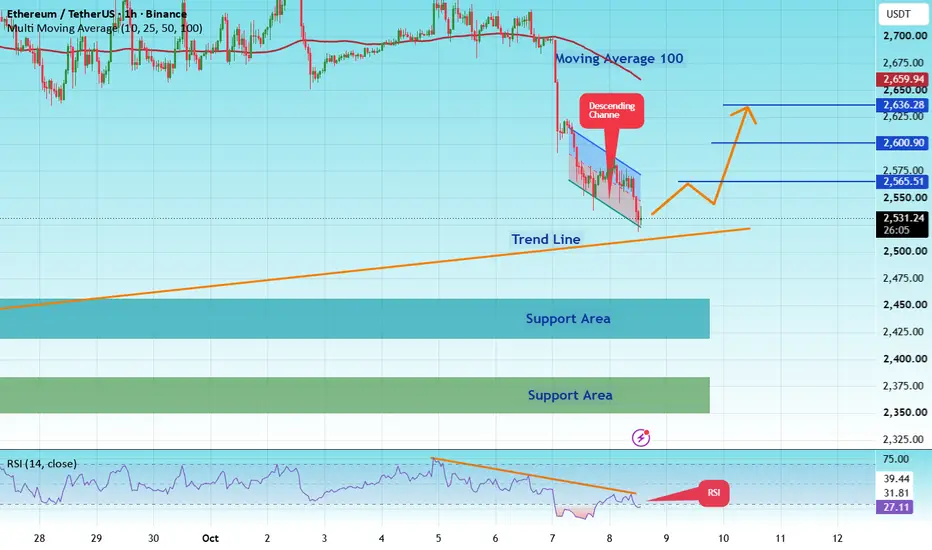
The price is moving within a descending channel on the 1-hour timeframe; having reached the lower boundary, it is poised for a rebound, suggesting a potential upward move upon retesting this level.
The Relative Strength Index (RSI) indicates a bearish trend; however, a bullish breakout is likely given that the price has reached "oversold" levels on the 1-hour chart.
An orange trendline supports the likelihood of a bullish rebound.
An initial support level exists at 2425, serving as a preliminary support zone.
A key support zone (marked in green) is located at 2350; the price has bounced from this area multiple times, making it a strong support level.
The price is moving toward the 100-period moving average (a level currently being approached), reinforcing the probability of an upward move.
Entry Price: 2536
Target 1: 2565
Target 2: 2600
Target 3: 2636
Stop Loss: At the green resistance zone.
Remember this simple rule: capital management.
If you have any questions, please leave a comment.
Thank you.

📍Trade Smart & Stay Protected⭐️
Join Our Telegram Channel Signals Futures and Spot Free
👉 t.me/+WN4RexVn8DM2MTlk
📌 We're open to Promotions, Ads & Partnerships
Join Our Telegram Channel Signals Futures and Spot Free
👉 t.me/+WN4RexVn8DM2MTlk
📌 We're open to Promotions, Ads & Partnerships
Feragatname
Bilgiler ve yayınlar, TradingView tarafından sağlanan veya onaylanan finansal, yatırım, alım satım veya diğer türden tavsiye veya öneriler anlamına gelmez ve teşkil etmez. Kullanım Koşulları bölümünde daha fazlasını okuyun.
📍Trade Smart & Stay Protected⭐️
Join Our Telegram Channel Signals Futures and Spot Free
👉 t.me/+WN4RexVn8DM2MTlk
📌 We're open to Promotions, Ads & Partnerships
Join Our Telegram Channel Signals Futures and Spot Free
👉 t.me/+WN4RexVn8DM2MTlk
📌 We're open to Promotions, Ads & Partnerships
Feragatname
Bilgiler ve yayınlar, TradingView tarafından sağlanan veya onaylanan finansal, yatırım, alım satım veya diğer türden tavsiye veya öneriler anlamına gelmez ve teşkil etmez. Kullanım Koşulları bölümünde daha fazlasını okuyun.