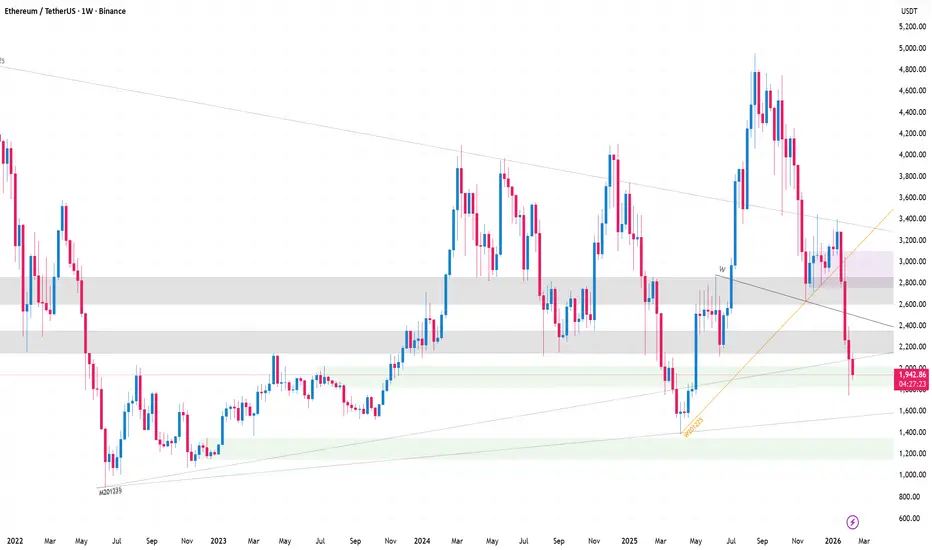

 ETHUSDT Weekly Breakdown: Bearish Structure Points Toward
Current Structure (Weekly)
Major High ~4,800–5,000
Clear distribution at the top.
Lower high formed after rejection.
Market Structure Shift
Strong bearish impulse from 4.8k → 2k.
Broke previous weekly higher lows.
That confirms HTF bearish shift.
Current Price ~2,000
Sitting near previous weekly demand.
But momentum candles are still bearish.
Volume spike on the recent drop = aggressive selling.
Bearish Scenario (Higher Probability Now)
Logic:
Lower High formed.
Strong displacement down.
No bullish BOS yet on weekly.
If 1,950–2,000 fails cleanly:
➡️ Next target: 1,600–1,700 (previous weekly liquidity pool)
➡️ Below that: 1,200–1,300 major demand
This is the logical draw on liquidity.
Bullish Scenario (Only If Structure Shifts)
To turn bullish:
Weekly close back above 2,600–2,700
Then break of 3,200 with strong volume
Only then we can target:
➡️ 3,800
➡️ 4,500+
Short-term: Possible small bounce from 2k zone.
Mid-term: Higher probability of sweep toward 1,600 liquidity before real reversal.
GOOD LUCK
TRADING BITE

Feragatname
Bilgiler ve yayınlar, TradingView tarafından sağlanan veya onaylanan finansal, yatırım, alım satım veya diğer türden tavsiye veya öneriler anlamına gelmez ve teşkil etmez. Kullanım Koşulları bölümünde daha fazlasını okuyun.
Feragatname
Bilgiler ve yayınlar, TradingView tarafından sağlanan veya onaylanan finansal, yatırım, alım satım veya diğer türden tavsiye veya öneriler anlamına gelmez ve teşkil etmez. Kullanım Koşulları bölümünde daha fazlasını okuyun.