

What I see!
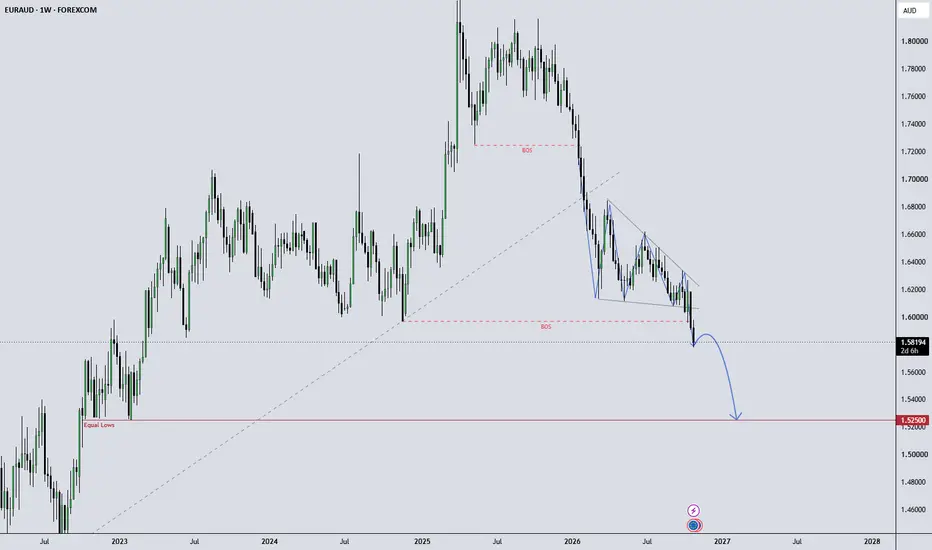
The Descending Triangle pattern appears to be confirmed, with price already breaking below the lower trendline.
Equal lows remain below the current price and could act as a liquidity target. If bearish momentum continues, price may move lower toward this liquidity area, with 1.5250 as a key downside level to watch.
Let’s see how price reacts around the breakout and liquidity zone.
This chart is shared purely for market observation and educational discussion.
The Descending Triangle pattern appears to be confirmed, with price already breaking below the lower trendline.
Equal lows remain below the current price and could act as a liquidity target. If bearish momentum continues, price may move lower toward this liquidity area, with 1.5250 as a key downside level to watch.
Let’s see how price reacts around the breakout and liquidity zone.
This chart is shared purely for market observation and educational discussion.
İşlem aktif

İlgili yayınlar
Feragatname
Bilgiler ve yayınlar, TradingView tarafından sağlanan veya onaylanan finansal, yatırım, alım satım veya diğer türden tavsiye veya öneriler anlamına gelmez ve teşkil etmez. Kullanım Koşulları bölümünde daha fazlasını okuyun.
İlgili yayınlar
Feragatname
Bilgiler ve yayınlar, TradingView tarafından sağlanan veya onaylanan finansal, yatırım, alım satım veya diğer türden tavsiye veya öneriler anlamına gelmez ve teşkil etmez. Kullanım Koşulları bölümünde daha fazlasını okuyun.