

1. The Macro Context (The "Why") 🌍
Hi traders! Before looking at the candles, let's look at the money.
My fundamental scoring table speaks clearly: there is a huge differential that we cannot ignore.
Key Factor Analysis:
🏦 Rate Expectations: Explanation: The BCE remains neutral with a trend holding stance and no clear bias in recent decisions, while the BOJ is the only hawkish central bank in the G7 with a recent +25bp hike and an aggressive stance. Score EUR: 0 Score JPY: +2
🎈 Inflation: Explanation: Eurozone inflation is at 2.14%, close to the 2% target, representing a controlled situation. JPY inflation at 2.91% is above target, justifying the BOJ's hawkish stance. Score EUR: 0 Score JPY: +1
📈 Growth/GDP: Explanation: Europe is facing worrying economic stagnation with a GDP of 0.7%. Japan's growth is also weak at 0.5%, which limits the space for overly aggressive rate hikes. Score EUR: -1 Score JPY: -1
🏭 PMI Data: Explanation: EUR PMI is neutral (weighted 50.65). JPY shows manufacturing expansion with a weighted PMI of 52.66. Score EUR: 0 Score JPY: +1
⚖️ Risk Sentiment: Explanation: Market is currently in a neutral regime; EUR is semi-cyclical and JPY is a safe-haven, but no significant risk-off flows are present. Score EUR: 0 Score JPY: 0
🗞️ News Catalyst: Explanation: Recent EUR CPI came in at 1.9% vs 2.0% expected, a moderate negative surprise. JPY benefits from exceptional hawkish policy momentum. Score EUR: 0 Score JPY: 0
Currency Score Summary:
Total Score EUR: -1 ([Weak]) Total Score JPY: +2 ([Strong])
Synthesis:
EUR (Weak, Score -1): The Euro is under pressure due to economic stagnation and a neutral central bank. JPY (Strong, Score +2): The Yen is strong, supported by a hawkish BOJ that stands out as an outlier in the G7. Conclusion: With this scenario, we are only looking for [Short].
Going against this bias would be statistical suicide.
2. The Technical Setup (The "Where") 📉
Timeframe: 4h | Pair: EUR/JPY
The SMC Market Structure + Price Zones [MaB] indicator gave us the confirmation we needed for our statistical edge.
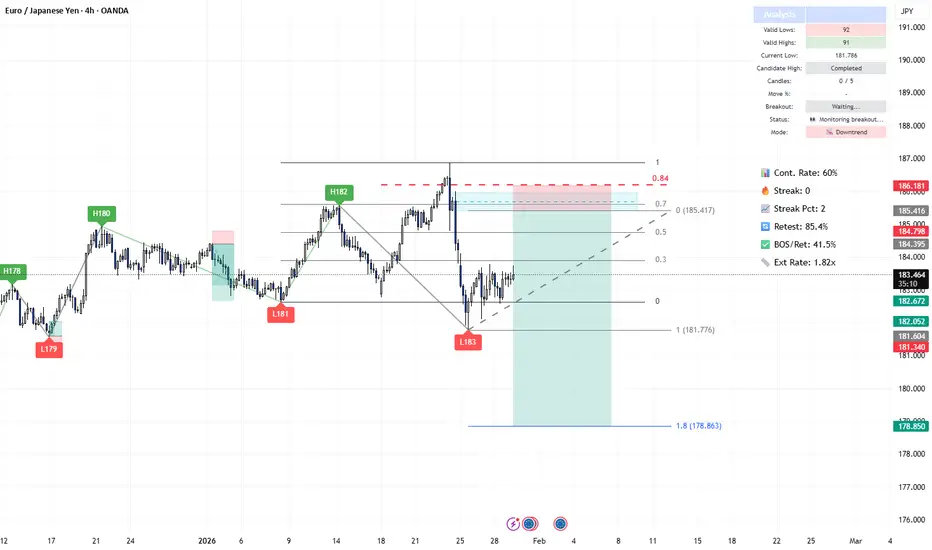
Here is where the indicator makes the difference. Look at the dashboard on the right, numbers don't lie:
🚀 Continuation Rate (60%): We are exactly at the 60% threshold.
This tells us the market is in a healthy, directional trend.
Statistically, betting on continuation pays off more than looking for a reversal.
🔥 Streak (0) & Streak Pct: 2 We are at the start of a potential new leg after a period of correction.
It's a mature trend (we are in the 2nd percentile of trend extension), so watch those stop losses, but as long as the music plays, we dance.
🔄 Retest (85.4%): The indicator tells us that statistically, when price creates a new Break of Structure (BOS), it retraces into the previous zone 85.4% of the time.
Therefore, it pays to wait for a deep retracement into the supply zone to maximize our Risk/Reward ratio.
💥 BOS/Ret Rate (41.5%): This parameter tells us that once price retraces inside the previous zone, it has a 41.5% probability of reacting and creating a new BOS.
🎯 Extension Rate (1.82x): The algorithm projects an ambitious target.
We expect this move to extend 1.82 times the current pullback leg. That's where we'll take profit.
3. Execution Plan on Chart
Moving to the chart, the SMC Market Structure + Price Zones [MaB] indicator supports us in pinpointing liquidity to define entry and stop loss:
Entry and Stop Loss: We place a limit entry in the Supply Zone 4h (Red Band) and the stop loss a few pips above the zone.
Take Profit: We leverage the asset's statistical analysis offered by the Extension Rate and place the target by measuring with Fibonacci at 1.8x relative to the pullback leg.
Trade Parameters:
Entry Price: 185.416 Stop Loss: 186.181 Take Profit: 178.850
⚠️ Disclaimer: This analysis is based on a proprietary algorithm and is shared exclusively for educational and didactic purposes.
It does not constitute financial advice or investment solicitation in any way. Trading involves significant risk.
Hi traders! Before looking at the candles, let's look at the money.
My fundamental scoring table speaks clearly: there is a huge differential that we cannot ignore.
Key Factor Analysis:
🏦 Rate Expectations: Explanation: The BCE remains neutral with a trend holding stance and no clear bias in recent decisions, while the BOJ is the only hawkish central bank in the G7 with a recent +25bp hike and an aggressive stance. Score EUR: 0 Score JPY: +2
🎈 Inflation: Explanation: Eurozone inflation is at 2.14%, close to the 2% target, representing a controlled situation. JPY inflation at 2.91% is above target, justifying the BOJ's hawkish stance. Score EUR: 0 Score JPY: +1
📈 Growth/GDP: Explanation: Europe is facing worrying economic stagnation with a GDP of 0.7%. Japan's growth is also weak at 0.5%, which limits the space for overly aggressive rate hikes. Score EUR: -1 Score JPY: -1
🏭 PMI Data: Explanation: EUR PMI is neutral (weighted 50.65). JPY shows manufacturing expansion with a weighted PMI of 52.66. Score EUR: 0 Score JPY: +1
⚖️ Risk Sentiment: Explanation: Market is currently in a neutral regime; EUR is semi-cyclical and JPY is a safe-haven, but no significant risk-off flows are present. Score EUR: 0 Score JPY: 0
🗞️ News Catalyst: Explanation: Recent EUR CPI came in at 1.9% vs 2.0% expected, a moderate negative surprise. JPY benefits from exceptional hawkish policy momentum. Score EUR: 0 Score JPY: 0
Currency Score Summary:
Total Score EUR: -1 ([Weak]) Total Score JPY: +2 ([Strong])
Synthesis:
EUR (Weak, Score -1): The Euro is under pressure due to economic stagnation and a neutral central bank. JPY (Strong, Score +2): The Yen is strong, supported by a hawkish BOJ that stands out as an outlier in the G7. Conclusion: With this scenario, we are only looking for [Short].
Going against this bias would be statistical suicide.
2. The Technical Setup (The "Where") 📉
Timeframe: 4h | Pair: EUR/JPY
The SMC Market Structure + Price Zones [MaB] indicator gave us the confirmation we needed for our statistical edge.
Here is where the indicator makes the difference. Look at the dashboard on the right, numbers don't lie:
🚀 Continuation Rate (60%): We are exactly at the 60% threshold.
This tells us the market is in a healthy, directional trend.
Statistically, betting on continuation pays off more than looking for a reversal.
🔥 Streak (0) & Streak Pct: 2 We are at the start of a potential new leg after a period of correction.
It's a mature trend (we are in the 2nd percentile of trend extension), so watch those stop losses, but as long as the music plays, we dance.
🔄 Retest (85.4%): The indicator tells us that statistically, when price creates a new Break of Structure (BOS), it retraces into the previous zone 85.4% of the time.
Therefore, it pays to wait for a deep retracement into the supply zone to maximize our Risk/Reward ratio.
💥 BOS/Ret Rate (41.5%): This parameter tells us that once price retraces inside the previous zone, it has a 41.5% probability of reacting and creating a new BOS.
🎯 Extension Rate (1.82x): The algorithm projects an ambitious target.
We expect this move to extend 1.82 times the current pullback leg. That's where we'll take profit.
3. Execution Plan on Chart
Moving to the chart, the SMC Market Structure + Price Zones [MaB] indicator supports us in pinpointing liquidity to define entry and stop loss:
Entry and Stop Loss: We place a limit entry in the Supply Zone 4h (Red Band) and the stop loss a few pips above the zone.
Take Profit: We leverage the asset's statistical analysis offered by the Extension Rate and place the target by measuring with Fibonacci at 1.8x relative to the pullback leg.
Trade Parameters:
Entry Price: 185.416 Stop Loss: 186.181 Take Profit: 178.850
⚠️ Disclaimer: This analysis is based on a proprietary algorithm and is shared exclusively for educational and didactic purposes.
It does not constitute financial advice or investment solicitation in any way. Trading involves significant risk.

Trading indicators development focused on Smart Money Concepts (SMC), market structure analysis, and liquidity zones.
WEBSITE: mab-arreca.com/
WHOP: whop.com/mab-9cb1/
YOUTUBE: youtube.com/@MaB.arreca
WEBSITE: mab-arreca.com/
WHOP: whop.com/mab-9cb1/
YOUTUBE: youtube.com/@MaB.arreca
İlgili yayınlar
Feragatname
Bilgiler ve yayınlar, TradingView tarafından sağlanan veya onaylanan finansal, yatırım, alım satım veya diğer türden tavsiye veya öneriler anlamına gelmez ve teşkil etmez. Kullanım Koşulları bölümünde daha fazlasını okuyun.
Trading indicators development focused on Smart Money Concepts (SMC), market structure analysis, and liquidity zones.
WEBSITE: mab-arreca.com/
WHOP: whop.com/mab-9cb1/
YOUTUBE: youtube.com/@MaB.arreca
WEBSITE: mab-arreca.com/
WHOP: whop.com/mab-9cb1/
YOUTUBE: youtube.com/@MaB.arreca
İlgili yayınlar
Feragatname
Bilgiler ve yayınlar, TradingView tarafından sağlanan veya onaylanan finansal, yatırım, alım satım veya diğer türden tavsiye veya öneriler anlamına gelmez ve teşkil etmez. Kullanım Koşulları bölümünde daha fazlasını okuyun.