

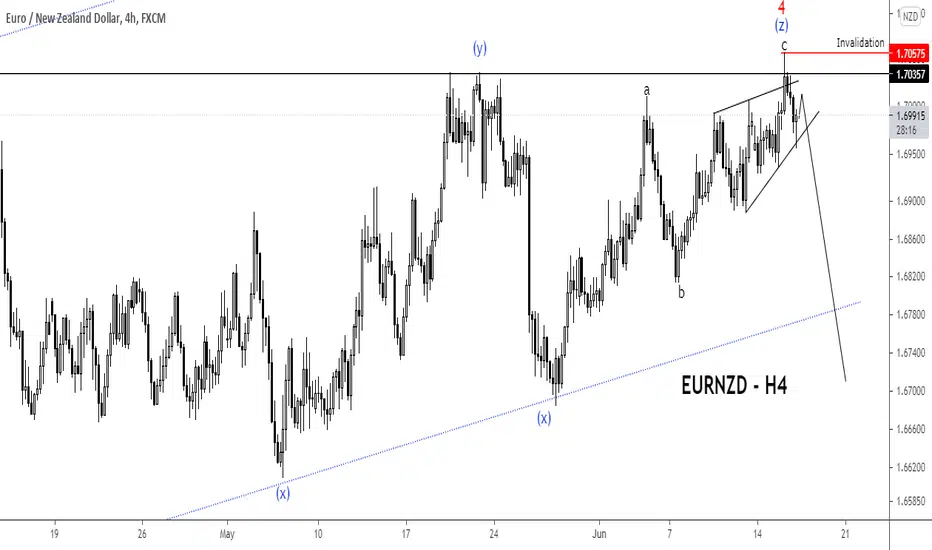
EURNZD has been in a corrective since February and seems to be topping out now.
The correction unfolded as a double zigzag pattern and the third zigzag is visible on this H4 chart above.
Wave c of (z) of 4 also unfolded as an ending diagonal which is a reversal pattern.
If this count is correct, any further rally must stay below the invalidation level on the chart and the price should head lower in a five-wave sequence.
Higher degree chart:
s3.tradingview.com/snapshots/x/X0SAc3i8.png
What's your view on EURNZD? Let me know in the comment.
The correction unfolded as a double zigzag pattern and the third zigzag is visible on this H4 chart above.
Wave c of (z) of 4 also unfolded as an ending diagonal which is a reversal pattern.
If this count is correct, any further rally must stay below the invalidation level on the chart and the price should head lower in a five-wave sequence.
Higher degree chart:
s3.tradingview.com/snapshots/x/X0SAc3i8.png
What's your view on EURNZD? Let me know in the comment.

Feragatname
Bilgiler ve yayınlar, TradingView tarafından sağlanan veya onaylanan finansal, yatırım, alım satım veya diğer türden tavsiye veya öneriler anlamına gelmez ve teşkil etmez. Kullanım Koşulları bölümünde daha fazlasını okuyun.
Feragatname
Bilgiler ve yayınlar, TradingView tarafından sağlanan veya onaylanan finansal, yatırım, alım satım veya diğer türden tavsiye veya öneriler anlamına gelmez ve teşkil etmez. Kullanım Koşulları bölümünde daha fazlasını okuyun.