

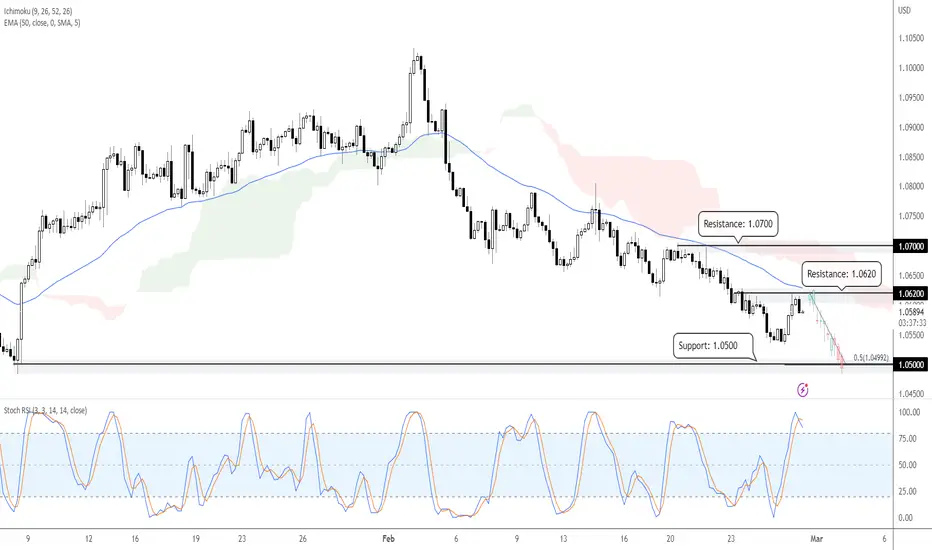
On the H4 timeframe, prices are showing bearish order flow with lower lows and lower highs formed. A pullback to the resistance zone at 1.0620 could present an opportunity to play the drop to the next support zone at 1.0500, in line with the graphical low and 50% Fibonacci extension. Prices are holding below the Ichimoku cloud and 50 EMA, while Stochastic RSI is in the overbought region above 80, supporting our bearish bias.

Feragatname
Bilgiler ve yayınlar, TradingView tarafından sağlanan veya onaylanan finansal, yatırım, alım satım veya diğer türden tavsiye veya öneriler anlamına gelmez ve teşkil etmez. Kullanım Koşulları bölümünde daha fazlasını okuyun.
Feragatname
Bilgiler ve yayınlar, TradingView tarafından sağlanan veya onaylanan finansal, yatırım, alım satım veya diğer türden tavsiye veya öneriler anlamına gelmez ve teşkil etmez. Kullanım Koşulları bölümünde daha fazlasını okuyun.