

EUR/USD Daily: Crucial Support at 1.13967 Violated – Mapping the Pullback Re-test and Downtrend Continuum
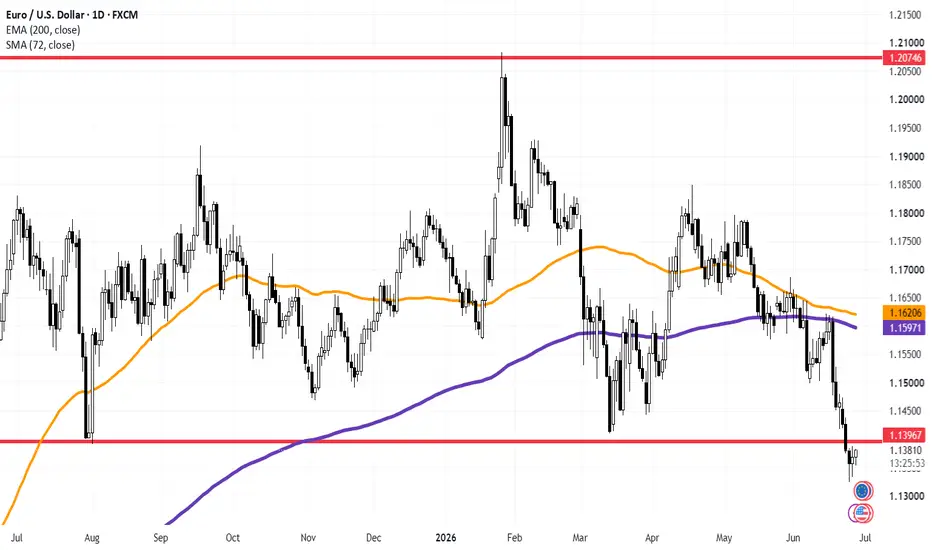
### 🇪🇺🇺🇸 EUR/USD Daily Macro Structural Analysis (Ref: EUR_USD_2026-06-26_08-24-55.png)
We are running a structural stress-test on the world’s most liquid currency pair, the EUR/USD, on the Daily (1D) matrix. The macro-technical architecture has undergone a definitive bearish shift, entering a clear markdown regime.
The pair is stabilizing within today's session at **1.13762 (+0.06%)** following an aggressive structural breakdown.
---
### 🔍 Technical Breakdown & Major Floor Violation:
1. **The Invalidation of 1.13967:** The defining technical event on this daily chart is the clean breakdown below the historical support baseline at **1.13967** (the lower red horizontal line). This level historically acted as a major liquidity spring (August 2025 and March 2026). Its violation formally flips this major psychological node into immediate overhead supply resistance.
2. **Moving Average Alignment:** The price action remains structurally heavy, trading substantially beneath both the **72-period SMA (orange line at 1.16205)** and the institutional **200-period EMA (purple line at 1.15971)**. The negative slope of the moving averages confirms that aggregate order flow remains under structural seller control.
---
### 🎯 Tactical Outlook & Intraday Re-test Target:
Despite the broader bearish architecture, shorting asset extensions directly into fresh multi-month lows yields sub-optimal win probabilities due to immediate mean-reversion risks.
* **The Local Exhaustion Footprint:** The final three daily prints exhibit clear downside wick extensions, signaling localized buying absorption and immediate downside exhaustion.
* **The Pullback Target:** The high-probability technical projection calls for a corrective relief rally (pullback) to re-test the newly established overhead resistance at **1.13967**.
### Strategic Blueprint:
We strictly avoid chasing the immediate short exposure here. Instead, our framework monitors the anticipated counter-trend bounce into the **1.13967 – 1.14000** zone. We will treat that specific area as a prime inflection node to scan lower-timeframe charts for institutional distribution structures, hunting for asymmetric short configurations to target the next macro downside extensions toward the **1.13000** handle.
---
📊 **ChartPro Data**
*FX Architecture, Structural Breakdown Matrices & Quantitative Sourcing.*
⚠️ **Disclaimer:** For educational and informational purposes only. This technical framework represents a personal trading model and does not constitute financial or investment advice.
### 🇪🇺🇺🇸 EUR/USD Daily Macro Structural Analysis (Ref: EUR_USD_2026-06-26_08-24-55.png)
We are running a structural stress-test on the world’s most liquid currency pair, the EUR/USD, on the Daily (1D) matrix. The macro-technical architecture has undergone a definitive bearish shift, entering a clear markdown regime.
The pair is stabilizing within today's session at **1.13762 (+0.06%)** following an aggressive structural breakdown.
---
### 🔍 Technical Breakdown & Major Floor Violation:
1. **The Invalidation of 1.13967:** The defining technical event on this daily chart is the clean breakdown below the historical support baseline at **1.13967** (the lower red horizontal line). This level historically acted as a major liquidity spring (August 2025 and March 2026). Its violation formally flips this major psychological node into immediate overhead supply resistance.
2. **Moving Average Alignment:** The price action remains structurally heavy, trading substantially beneath both the **72-period SMA (orange line at 1.16205)** and the institutional **200-period EMA (purple line at 1.15971)**. The negative slope of the moving averages confirms that aggregate order flow remains under structural seller control.
---
### 🎯 Tactical Outlook & Intraday Re-test Target:
Despite the broader bearish architecture, shorting asset extensions directly into fresh multi-month lows yields sub-optimal win probabilities due to immediate mean-reversion risks.
* **The Local Exhaustion Footprint:** The final three daily prints exhibit clear downside wick extensions, signaling localized buying absorption and immediate downside exhaustion.
* **The Pullback Target:** The high-probability technical projection calls for a corrective relief rally (pullback) to re-test the newly established overhead resistance at **1.13967**.
### Strategic Blueprint:
We strictly avoid chasing the immediate short exposure here. Instead, our framework monitors the anticipated counter-trend bounce into the **1.13967 – 1.14000** zone. We will treat that specific area as a prime inflection node to scan lower-timeframe charts for institutional distribution structures, hunting for asymmetric short configurations to target the next macro downside extensions toward the **1.13000** handle.
---
📊 **ChartPro Data**
*FX Architecture, Structural Breakdown Matrices & Quantitative Sourcing.*
⚠️ **Disclaimer:** For educational and informational purposes only. This technical framework represents a personal trading model and does not constitute financial or investment advice.

Feragatname
Bilgiler ve yayınlar, TradingView tarafından sağlanan veya onaylanan finansal, yatırım, alım satım veya diğer türden tavsiye veya öneriler anlamına gelmez ve teşkil etmez. Kullanım Koşulları bölümünde daha fazlasını okuyun.
Feragatname
Bilgiler ve yayınlar, TradingView tarafından sağlanan veya onaylanan finansal, yatırım, alım satım veya diğer türden tavsiye veya öneriler anlamına gelmez ve teşkil etmez. Kullanım Koşulları bölümünde daha fazlasını okuyun.