

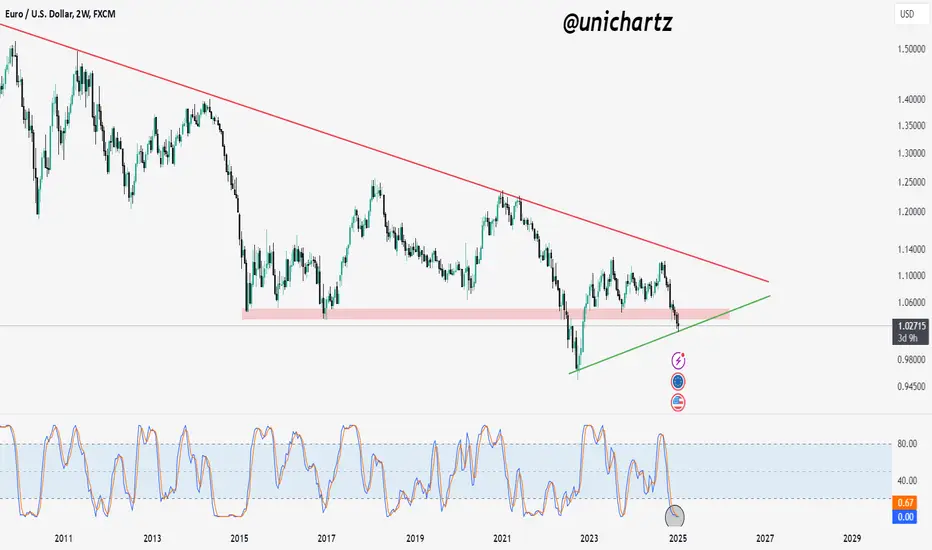
EUR/USD analysis on the 2-week timeframe (14 days), the chart clearly shows that the price has faced multiple rejections from the upper resistance line, marked in red. Additionally, the price has broken below the strong 2-week support zone and is now trading just above the lower supportive trendline, indicated by the green line.
The Stochastic RSI is signaling a potential reversal, suggesting that the current price action may retest the breakout levels before making a decisive move. This could either lead to a rebound from the support or further bearish continuation if the trendline breaks.
The Stochastic RSI is signaling a potential reversal, suggesting that the current price action may retest the breakout levels before making a decisive move. This could either lead to a rebound from the support or further bearish continuation if the trendline breaks.

Daily Free Signals :bit.ly/UnichartzAlpha
Register on Bitunix and trade with me: 👇
bitunix.com/register?vipCode=coEA
Register on Bitunix and trade with me: 👇
bitunix.com/register?vipCode=coEA
Feragatname
Bilgiler ve yayınlar, TradingView tarafından sağlanan veya onaylanan finansal, yatırım, alım satım veya diğer türden tavsiye veya öneriler anlamına gelmez ve teşkil etmez. Kullanım Koşulları bölümünde daha fazlasını okuyun.
Daily Free Signals :bit.ly/UnichartzAlpha
Register on Bitunix and trade with me: 👇
bitunix.com/register?vipCode=coEA
Register on Bitunix and trade with me: 👇
bitunix.com/register?vipCode=coEA
Feragatname
Bilgiler ve yayınlar, TradingView tarafından sağlanan veya onaylanan finansal, yatırım, alım satım veya diğer türden tavsiye veya öneriler anlamına gelmez ve teşkil etmez. Kullanım Koşulları bölümünde daha fazlasını okuyun.