

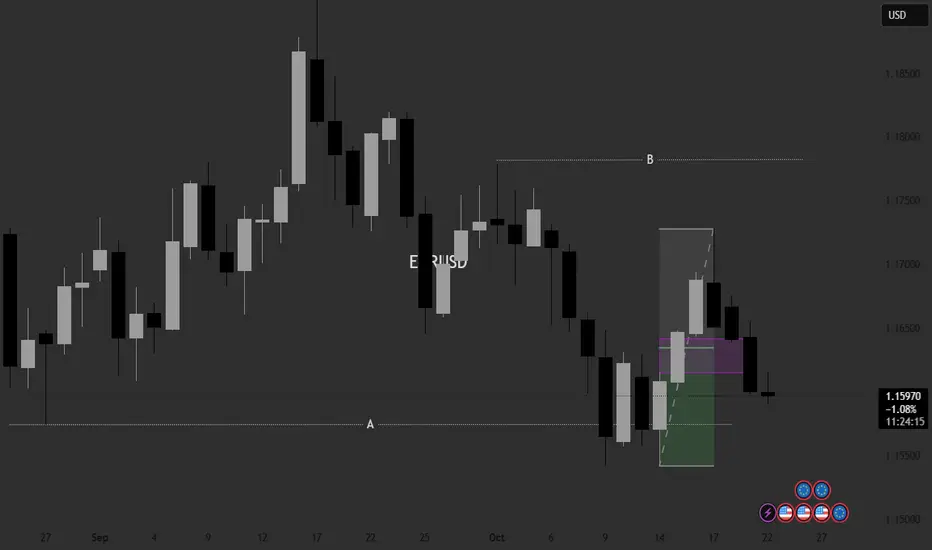
The price is reacting to the weekly key level and is forming a daily range with new structural zones. On the daily chart, we can see a break of the D FVG, which indicates the strength of the sellers. However, the price is moving into discount areas, which by themselves are zones of buyers’ interest. The key factor will be the daily candle close — if it closes above the 0.5 level of the range, it will indicate that the range has been balanced, and we can start considering long positions.
İşlem aktif
If the price on the 4-hour chart stabilizes above the marked level, thereby forming an SNR, it will be possible to consider trades for updating the range.

Feragatname
Bilgiler ve yayınlar, TradingView tarafından sağlanan veya onaylanan finansal, yatırım, alım satım veya diğer türden tavsiye veya öneriler anlamına gelmez ve teşkil etmez. Kullanım Koşulları bölümünde daha fazlasını okuyun.
Feragatname
Bilgiler ve yayınlar, TradingView tarafından sağlanan veya onaylanan finansal, yatırım, alım satım veya diğer türden tavsiye veya öneriler anlamına gelmez ve teşkil etmez. Kullanım Koşulları bölümünde daha fazlasını okuyun.