full disclosure: I'm long the Dec19'14 puts @ $50
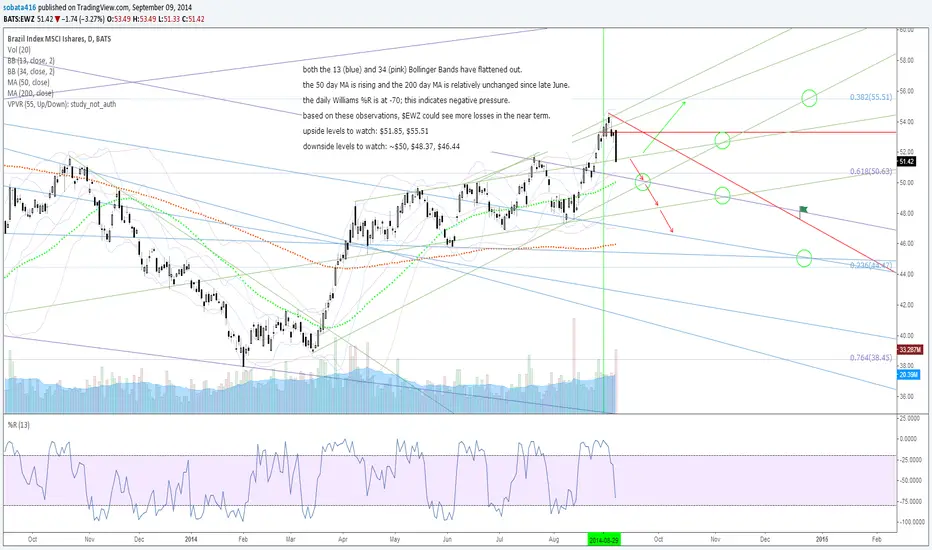
both the 13 (blue) and 34 (pink) Bollinger Bands have flattened out.
the 50 day MA is rising and the 200 day MA is relatively unchanged since late June.
the daily Williams %R is at -70; this indicates that pressure might turn negative.
based on these observations, EWZ could see more losses in the near term.
upside levels to watch: $51.85, $55.51
downside levels to watch: ~$50, $48.37, $46.44
both the 13 (blue) and 34 (pink) Bollinger Bands have flattened out.
the 50 day MA is rising and the 200 day MA is relatively unchanged since late June.
the daily Williams %R is at -70; this indicates that pressure might turn negative.
based on these observations,
EWZ could see more losses in the near term.upside levels to watch: $51.85, $55.51
downside levels to watch: ~$50, $48.37, $46.44

Feragatname
Bilgiler ve yayınlar, TradingView tarafından sağlanan veya onaylanan finansal, yatırım, alım satım veya diğer türden tavsiye veya öneriler anlamına gelmez ve teşkil etmez. Kullanım Koşulları bölümünde daha fazlasını okuyun.
Feragatname
Bilgiler ve yayınlar, TradingView tarafından sağlanan veya onaylanan finansal, yatırım, alım satım veya diğer türden tavsiye veya öneriler anlamına gelmez ve teşkil etmez. Kullanım Koşulları bölümünde daha fazlasını okuyun.