
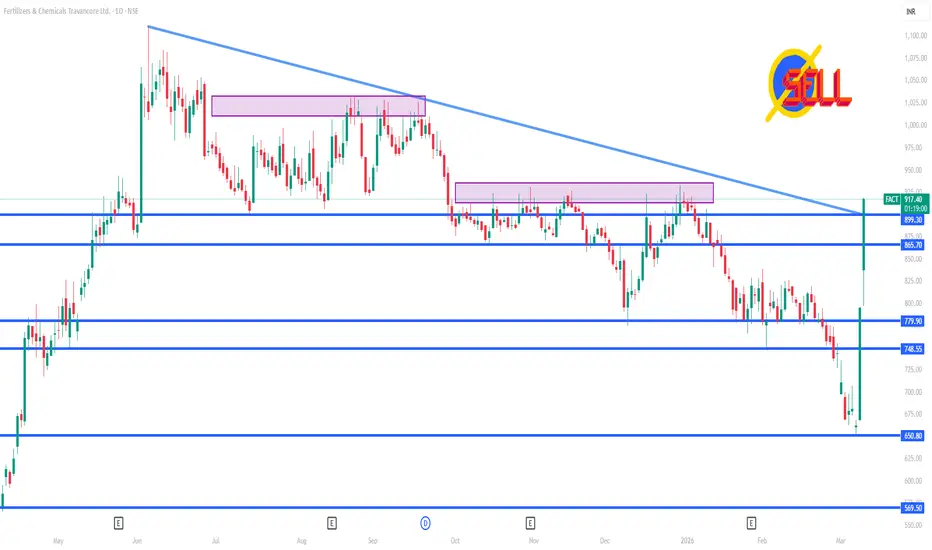
📌 Current price context (latest available):
– FACT has recently traded in a range roughly ₹795–₹880 intraday on the NSE (price fluctuating within that band) — indicating volatility around these zones recently.
📊 Daily Levels (1‑Day Time Frame)
🔹 Pivot & Key Levels (classic pivot)
(Typical pivot points traders use for intraday/next‑day reference)
Pivot Point (PP): ~ ₹797
Resistance 1 (R1): ~ ₹815–₹818
Resistance 2 (R2): ~ ₹838–₹840
Resistance 3 (R3): ~ ₹855–₹860
Support 1 (S1): ~ ₹775–₹772
Support 2 (S2): ~ ₹757–₹750
Support 3 (S3): ~ ₹735–₹730
(based on last session pivot calculations used by brokers and technical analysts)
📈 Instant Resistances to Watch
These are short‑term upside barriers where price may struggle to break above:
~₹815–₹818 — first resistance
~₹838–₹840 — next resistance zone
~₹855–₹860 — higher resistance if price gains strength
📉 Immediate Supports
These are downside levels where buyers may step in:
~₹775–₹772 — first support
~₹757–₹750 — deeper support
~₹735–₹730 — strong support if market weakens further
🧠 How Traders Typically Use These Levels
✅ Long entry zone: Around S1–S2 (~₹775–₹750) with a break back above pivot.
⚠️ Rejection near R1–R2 (~₹815–₹840) may lead to pullbacks.
📌 Break above R3 (~₹855+) with volume could shift bias bullish in the short term.
📌 Break below S3 (~₹730) may signal further downside pressure.
– FACT has recently traded in a range roughly ₹795–₹880 intraday on the NSE (price fluctuating within that band) — indicating volatility around these zones recently.
📊 Daily Levels (1‑Day Time Frame)
🔹 Pivot & Key Levels (classic pivot)
(Typical pivot points traders use for intraday/next‑day reference)
Pivot Point (PP): ~ ₹797
Resistance 1 (R1): ~ ₹815–₹818
Resistance 2 (R2): ~ ₹838–₹840
Resistance 3 (R3): ~ ₹855–₹860
Support 1 (S1): ~ ₹775–₹772
Support 2 (S2): ~ ₹757–₹750
Support 3 (S3): ~ ₹735–₹730
(based on last session pivot calculations used by brokers and technical analysts)
📈 Instant Resistances to Watch
These are short‑term upside barriers where price may struggle to break above:
~₹815–₹818 — first resistance
~₹838–₹840 — next resistance zone
~₹855–₹860 — higher resistance if price gains strength
📉 Immediate Supports
These are downside levels where buyers may step in:
~₹775–₹772 — first support
~₹757–₹750 — deeper support
~₹735–₹730 — strong support if market weakens further
🧠 How Traders Typically Use These Levels
✅ Long entry zone: Around S1–S2 (~₹775–₹750) with a break back above pivot.
⚠️ Rejection near R1–R2 (~₹815–₹840) may lead to pullbacks.
📌 Break above R3 (~₹855+) with volume could shift bias bullish in the short term.
📌 Break below S3 (~₹730) may signal further downside pressure.

Contact Knowledgehub for a detailed consultation: Dm on WhatsApp: [wa.link/a2o0kz]-
Phone No: [+91 93102 26243]-
Email: [tradingviewknowledgehub@gmail.com]---
-- Let’s achieve success together!
Phone No: [+91 93102 26243]-
Email: [tradingviewknowledgehub@gmail.com]---
-- Let’s achieve success together!
İlgili yayınlar
Feragatname
Bilgiler ve yayınlar, TradingView tarafından sağlanan veya onaylanan finansal, yatırım, alım satım veya diğer türden tavsiye veya öneriler anlamına gelmez ve teşkil etmez. Kullanım Koşulları bölümünde daha fazlasını okuyun.
Contact Knowledgehub for a detailed consultation: Dm on WhatsApp: [wa.link/a2o0kz]-
Phone No: [+91 93102 26243]-
Email: [tradingviewknowledgehub@gmail.com]---
-- Let’s achieve success together!
Phone No: [+91 93102 26243]-
Email: [tradingviewknowledgehub@gmail.com]---
-- Let’s achieve success together!
İlgili yayınlar
Feragatname
Bilgiler ve yayınlar, TradingView tarafından sağlanan veya onaylanan finansal, yatırım, alım satım veya diğer türden tavsiye veya öneriler anlamına gelmez ve teşkil etmez. Kullanım Koşulları bölümünde daha fazlasını okuyun.