FB (Meta) - Recovery Along Trend Line
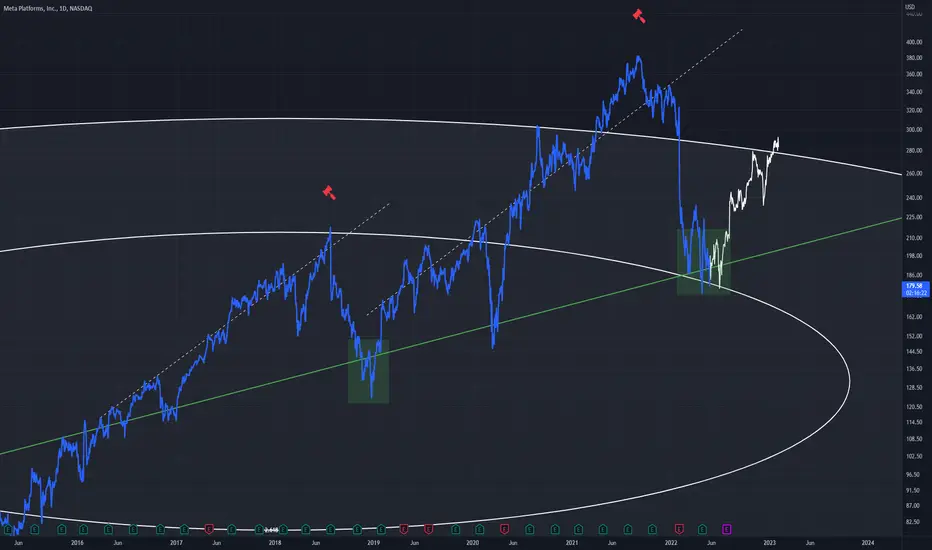
Similarities can be seen between the first dotted upward trend leading to a rejection, and the second also leading to a rejection
Both retrace to the same uptrend
This is the daily chart, with the first rejection at 2.618 and the second at 4.618
Good buy potential on this daily timeframe
Both retrace to the same uptrend
This is the daily chart, with the first rejection at 2.618 and the second at 4.618
Good buy potential on this daily timeframe

Feragatname
Bilgiler ve yayınlar, TradingView tarafından sağlanan veya onaylanan finansal, yatırım, alım satım veya diğer türden tavsiye veya öneriler anlamına gelmez ve teşkil etmez. Kullanım Koşulları bölümünde daha fazlasını okuyun.
Feragatname
Bilgiler ve yayınlar, TradingView tarafından sağlanan veya onaylanan finansal, yatırım, alım satım veya diğer türden tavsiye veya öneriler anlamına gelmez ve teşkil etmez. Kullanım Koşulları bölümünde daha fazlasını okuyun.