
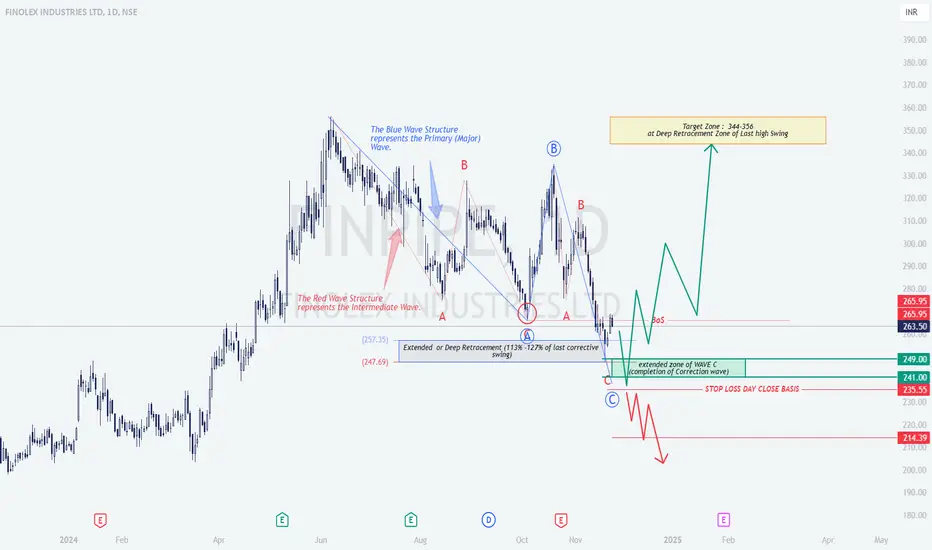
Finolex Industries Ltd: Wave Structure and Fibonacci Confluence Analysis
1. Overview
This chart analysis of Finolex Industries Ltd leverages Elliott Wave Theory and Fibonacci retracement zones to identify high-probability price movements. It captures the interaction of a primary wave (blue) and an intermediate wave (red), providing insight into the potential price reversal and future targets.
2. Technical Breakdown
Wave B: Forms a minor retracement, lacking strong upward momentum.
Wave C: Extended downward move, aligning with the critical retracement zone of 113%–127% Fibonacci.
3. Logical Interpretation of Price Action
4. Strategy Recommendations
Entry Points:
Targets:
Stop-Loss:
Alternative Scenario:
5. Educational Insights
6. Summary
This analysis of Finolex Industries Ltd combines Elliott Wave Theory and Fibonacci retracements to outline a potential bullish scenario. The setup offers a clear risk-reward strategy for traders, emphasizing key zones like the ₹241–₹249 support area and the ₹344–₹356 target zone. Adopting disciplined risk management with stop-loss placement ensures effective trade execution in a volatile market.
1. Overview
This chart analysis of Finolex Industries Ltd leverages Elliott Wave Theory and Fibonacci retracement zones to identify high-probability price movements. It captures the interaction of a primary wave (blue) and an intermediate wave (red), providing insight into the potential price reversal and future targets.
2. Technical Breakdown
Wave B: Forms a minor retracement, lacking strong upward momentum.
Wave C: Extended downward move, aligning with the critical retracement zone of 113%–127% Fibonacci.
3. Logical Interpretation of Price Action
4. Strategy Recommendations
Entry Points:
Targets:
Stop-Loss:
Alternative Scenario:
5. Educational Insights
6. Summary
This analysis of Finolex Industries Ltd combines Elliott Wave Theory and Fibonacci retracements to outline a potential bullish scenario. The setup offers a clear risk-reward strategy for traders, emphasizing key zones like the ₹241–₹249 support area and the ₹344–₹356 target zone. Adopting disciplined risk management with stop-loss placement ensures effective trade execution in a volatile market.

Feragatname
Bilgiler ve yayınlar, TradingView tarafından sağlanan veya onaylanan finansal, yatırım, alım satım veya diğer türden tavsiye veya öneriler anlamına gelmez ve teşkil etmez. Kullanım Koşulları bölümünde daha fazlasını okuyun.
Feragatname
Bilgiler ve yayınlar, TradingView tarafından sağlanan veya onaylanan finansal, yatırım, alım satım veya diğer türden tavsiye veya öneriler anlamına gelmez ve teşkil etmez. Kullanım Koşulları bölümünde daha fazlasını okuyun.