
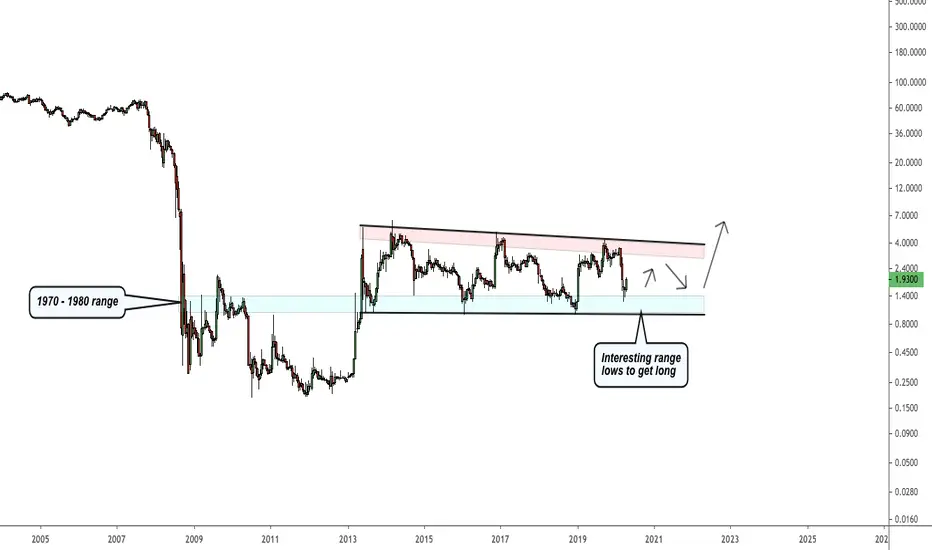
Fannie Mae is setting up to be an interesting rectangular chart pattern. At some point FNMA will breakout and it'll be a high probability trade. Until then, the range lows offer an interesting long set-up with targets at the top of the range. This could take 2-5 years before breaking out (or less/more). From 1970 - 1986, FNMA did nothing except trade in a range before finally breaking out. Just a good one to keep an eye on, potentially a good indicator for the broader market as well - everytime Fannie Mae hit the lows of the range the broader market was a great buy.
Percentage increase from the lows of the range generated a strong average return since 2013

Percentage increase from the lows of the range generated a strong average return since 2013

Feragatname
Bilgiler ve yayınlar, TradingView tarafından sağlanan veya onaylanan finansal, yatırım, alım satım veya diğer türden tavsiye veya öneriler anlamına gelmez ve teşkil etmez. Kullanım Koşulları bölümünde daha fazlasını okuyun.
Feragatname
Bilgiler ve yayınlar, TradingView tarafından sağlanan veya onaylanan finansal, yatırım, alım satım veya diğer türden tavsiye veya öneriler anlamına gelmez ve teşkil etmez. Kullanım Koşulları bölümünde daha fazlasını okuyun.