FTM
Hi,
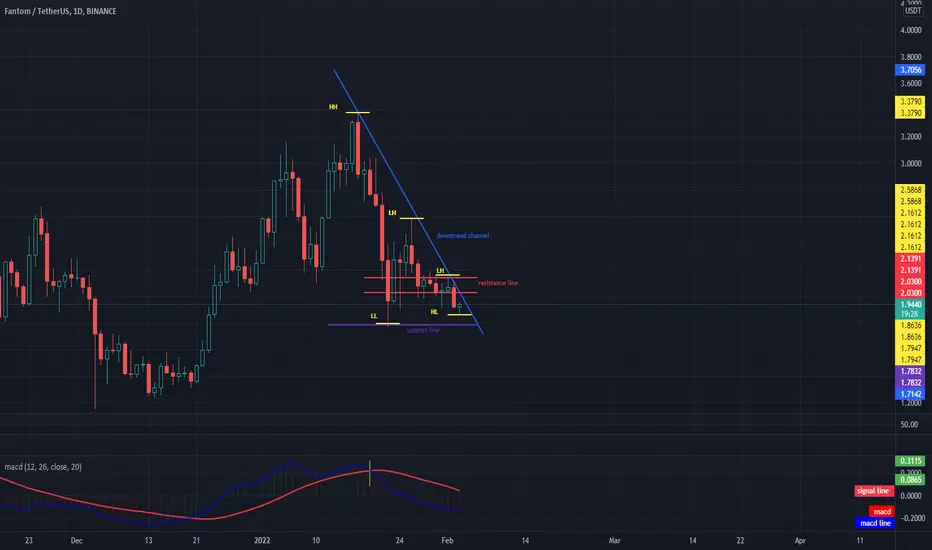
Looking at the FTM / USDT chart, you can see that we are on the uptrend line, while the pattern formed of lower and lower highs and lows indicates a downward trend. Currently, price needs to break a low at $ 2.1612 for a potential trend to reverse. The current support is at $ 1.7832 and the first resistance is at $ 2.03.
Looking at the FTM / USDT chart, you can see that we are on the uptrend line, while the pattern formed of lower and lower highs and lows indicates a downward trend. Currently, price needs to break a low at $ 2.1612 for a potential trend to reverse. The current support is at $ 1.7832 and the first resistance is at $ 2.03.

Feragatname
Bilgiler ve yayınlar, TradingView tarafından sağlanan veya onaylanan finansal, yatırım, alım satım veya diğer türden tavsiye veya öneriler anlamına gelmez ve teşkil etmez. Kullanım Koşulları bölümünde daha fazlasını okuyun.
Feragatname
Bilgiler ve yayınlar, TradingView tarafından sağlanan veya onaylanan finansal, yatırım, alım satım veya diğer türden tavsiye veya öneriler anlamına gelmez ve teşkil etmez. Kullanım Koşulları bölümünde daha fazlasını okuyun.