Alış
GALA: Inverted
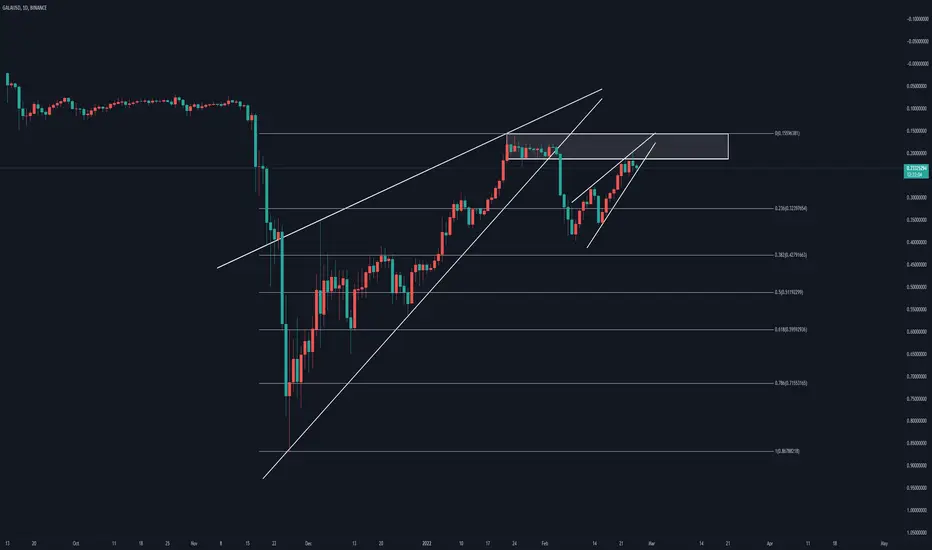
I like to invert the charts sometimes for a different perspective. We can see that on the inverted chart, GALA was in a massive rising wedge for about 75 days, broke down, and looks to be in another possible rising wedge.
It'll be interesting to see where GALA is later this year.
Happy trading :-)
It'll be interesting to see where GALA is later this year.
Happy trading :-)

Feragatname
Bilgiler ve yayınlar, TradingView tarafından sağlanan veya onaylanan finansal, yatırım, alım satım veya diğer türden tavsiye veya öneriler anlamına gelmez ve teşkil etmez. Kullanım Koşulları bölümünde daha fazlasını okuyun.
Feragatname
Bilgiler ve yayınlar, TradingView tarafından sağlanan veya onaylanan finansal, yatırım, alım satım veya diğer türden tavsiye veya öneriler anlamına gelmez ve teşkil etmez. Kullanım Koşulları bölümünde daha fazlasını okuyun.