
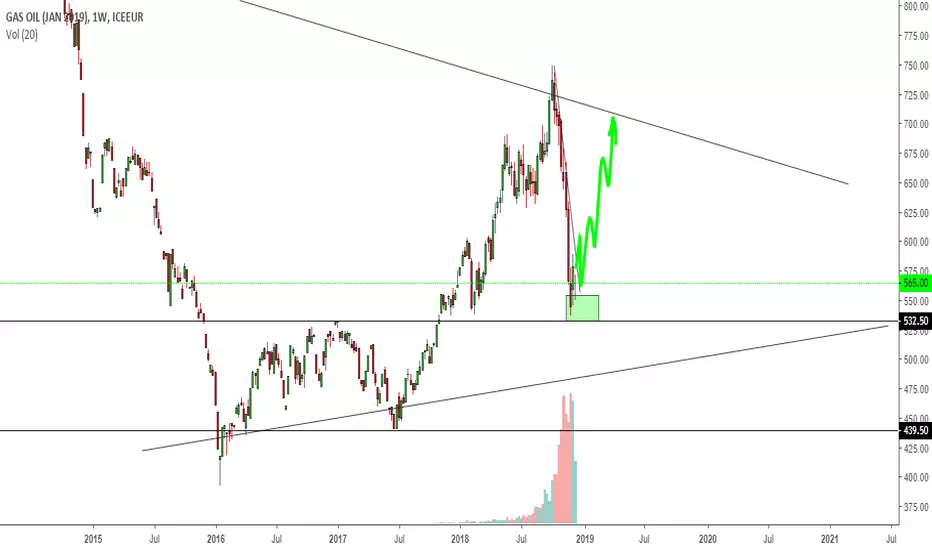
Gas Oil futures price is currently testing the 61.8% retracement of the previous uptrend and this also happens to be a zone almost in confluence with the support zone. The price also seems to be forming a symmetrical triangle on the upper timeframes, therefore we should watch how the price tests those support and resistance zones, as those areas can provide good entry or exit points. This chart is suitable for day traders as the lower time frames are missing, therefore intra-day traders be careful.

Feragatname
Bilgiler ve yayınlar, TradingView tarafından sağlanan veya onaylanan finansal, yatırım, alım satım veya diğer türden tavsiye veya öneriler anlamına gelmez ve teşkil etmez. Kullanım Koşulları bölümünde daha fazlasını okuyun.
Feragatname
Bilgiler ve yayınlar, TradingView tarafından sağlanan veya onaylanan finansal, yatırım, alım satım veya diğer türden tavsiye veya öneriler anlamına gelmez ve teşkil etmez. Kullanım Koşulları bölümünde daha fazlasını okuyun.